- Side By Side Study Of Energy Use And Moisture Control
Comparing Standard Split System Air Conditioning And A
Coleman® Prototype Heat Pump, Bousier
City, LA
In
2001, the BAIHP team conducted research on two homes to
define how tight ducts and a prototype Coleman® heat
pump (proprietary technology) affect energy use and moisture
control in a hot, humid climate. FSEC, in collaboration with
Fleetwood Homes, York International Manufactured Housing
Division (now Stylecrest Sales), and Coleman®, monitored
two nearly identical side-by-side homes in Bossier City,
Louisiana. The homes contained different air conditioning
systems. House A used a standard split air conditioner, while
House B used the Coleman® prototype unit (a more efficient,
two-speed split air conditioner).
Figure 45 shows the reduced power draw of the two-speed
compressor (green, dotted line) over a 24-hour period on
September 2, 2000. With the unit operating at low-speed for
most of the day, the cooling energy savings were 28% when
compared to the energy use in House A. Average daily cooling
energy was reduced by about 12% over the monitored period.
An added benefit of the two-speed air conditioner was 20%
greater moisture removal on days with an outdoor dewpoint
above 60 F.
|
Figure
45 Power draw
over a
24-hour period, September 2, 2000. |
Savings from Duct Repair and POS Ventilation: In addition
to comparing one house to the other, the BAIHP team also
compared home performance before and after ductwork and ventilation
system changes were made.
To make the comparison, duct and other
leaks were sealed in both houses until the two were equally
airtight. The ventilation method in each home also was
changed from exhaust-only to a positive pressure system (POS).
With exhaust-only ventilation, bathroom fans removed stale
air from the home which caused fresh air to be pulled
in through the building envelope. To simulate occupant
use, two bath exhaust fans were operated by a timer for
three hours in the morning and six hours in the evening.
In contrast to exhaust ventilation, the POS system introduced
a small amount of fresh air on the return side of the air conditioning
cooling coil. A POS system was installed in each home at the
same time the ducts were repaired. Subsequent monitoring looked
at the effects of this alternate ventilation system. Tightening
the ducts and installing a POS ventilation system resulted
in an 18% and 37% cooling savings in the two homes. Only about
2% of these savings were attributable to the ventilation system
change, the remaining savings are a result of duct repair.
|
Figure 45
WSU
Energy House
in Olympia, WA |
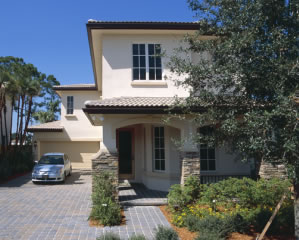
This 2600 ft 2 home was built beyond SGC standards and incorporates
Energy Star lighting and appliances. The home (Figure
45) has received significant national exposure through
WSU campus and alumni newsletters, tours, the BAIHP website,
and local and trade media including an article in the Automated
Builder magazine and a feature by KING 5 News of Seattle.
WSU staff uses the house to try out innovative technologies
and testing methods.
In
the 5th budget period, BAIHP staff developed a moisture case
study based on research at the WSU Energy House, published
under a separate Building America project. The WSU Energy
House has been monitored since 2000. Collected monitoring
data includes weather, temperature, humidity, CO 2, CO, and
eight differential pressures. Energy use data
is being collected for water heating, laundry, fireplace
and heating, ventilating, and air conditioning (HVAC). Data
from the house is available on the BAIHP web page (under
Current Data) and has been presented to the building science,
indoor air quality (IAQ) and HVAC research communities at
conferences sponsored by ASHRAE, Air Infiltration and Ventilation
Center (in the UK), HUD/NIST, NFPA, and
BTECC. (See also Appendix D, WSU)
Working
with Ecotope, ASHRAE, and the Energy Conservancy, BAIHP
staff conducted “Delta Q” and “nulling” duct
leakage tests in 2001. Follow up pressure tests and
analysis of test data conducted in 2002 indicate these tests
are effective methods of measuring duct leakage in manufactured
homes, and may be included in the upgrades to the National
Fire Protection Association-501 standards for manufactured
homes.
Blower door and duct leakage testing indicate very good
whole house and duct airtightness (2.4 ACH50 and 61.6 CFM50
out). Tracer gas testing demonstrated that the use of a furnace-based
intake damper does not change the leakage rate of the home.
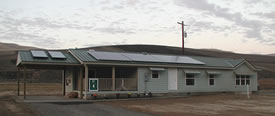
- Zero Energy Manufactured Home (ZEMH)
|
Figure
46: Zero Energy
Manufactured Home, on site
at
the Nez Perce Fish Hatchery |
BPA,
working with BAIHP staff in Idaho and Washington, provided
funding for the most energy efficient manufactured home
in the country. The RFP was sent to 18 Northwest manufacturers;
Kit HomeBuilders West of Caldwell, Idaho was selected as
the manufacturer of the home. BAIHP staff solicited 24
industry partners to provide energy efficient building
components, including Icynene wall, floor and roof insulation,
a low-cost HUD-approved solar system, sun-tempered solar
design, and Energy Star© windows,
appliances and lighting. Partners include Building America
Team members such as Flexible Technologies, Icynene and
LaSalle. Complete list of specifications provided in Table 24.
The ZEMH (Figure 46) was built in Year 4 along
with a control home. The ZEMH was displayed at the 2002 Spokane
County Interstate Fair before siting at the Nez Perce tribal
fish facility near Lewiston Idaho. Blower door and duct leakage
tests at the plant and on-site indicate that this is the
tightest home ever tested by BAIHP staff.
Working with FSEC and BPA, BAIHP staff installed monitoring
equipment for the ZEMH. Monitoring began in the 5th budget
period and includes the following:
- Total electric use from grid
- Resistance elements in heat pump
- Heat pump compressor and fan motors
- Water heating equipment, including gallons used
- PV energy production (ZEMH)
TABLE
24 Zero Energy Manufactured Home (ZEMH)
and Base
Case Home (Control) |
Component |
ZEMH |
Base |
Wall Structure |
2x6 ft, 16 in on center |
Same |
Wall Insulation |
R21 foam-spray |
R21 batt |
Floor Structure |
2x8 ft, 16 in on center |
Same |
Floor Insulation |
R33 (R22 Foam + R11 batt) |
R33 Blown Cellulose |
Vented crawl space wall |
R14 foil faced foam |
None |
Roof/Attic Structure and
Finish |
16
in on center
40
lb roof load
4/12
pitch metal roofing
|
24
in on center
Standard
30 lb roof load
Same
pitch and finish
|
Roof/Attic Insulation |
R49 foam |
R33 blown cellulose |
Window/Floor area ratio |
12% |
Same |
Windows |
Vinyl Frame, Argon filled,
low-e, Energy Star Approved |
Same |
Window Shading |
Dual blinds, heavy drapes,
awnings |
Single blinds, light drapes |
Doors |
U=0.2 metal, foam w/thermal
break |
Same |
Solar |
Solar
ready design (mounts, flashings and electrical chase)
4.2
kW peak rated PV system with a 4 kW inverter and
12 kWh battery array
|
None |
HVAC |
2
ton unitary air-source heat pump
12
seer, 7.8 HSPF
|
Same |
Zone heat |
150 W Radiant Panel in
kitchen |
None |
Ducts and cross over |
R8
crossover
Flex
Flow crossover system
Mastic
with screws
More
efficient duct design
|
R8
crossover
Sheet
metal elbows
Standard
foil tape
|
Lighting |
100% Energy Star T8 and
CFL fixtures |
T12 and Incandescent fixtures |
Appliances |
Energy Star washer and
dryer, refrigerator, dishwasher |
Standard equipment |
Whole House Ventilation |
Heat Recovery Ventilator
w/HEPA, continuous operation (turned off in 8/04) |
Quiet (low-sone) Energy
Star exhaust fan, continuous operation |
Spot Ventilation |
Energy Star bath fans,
std. Kitchen fan |
Quiet (low-sone) bath
fans, std. Kitchen fan |
Ceiling Fans |
Energy Star with dimmable
CFL |
Standard with Incandescent
bulbs |
Domestic Hot Water |
PV controlled, active
anti-freeze solar water system, with 80 gallon storage,
and 64 ft 2 of collector area solar pre-heat tank (pre-plumbed),
40 gallon standard tank EF=0.93 |
EF=0.88 standard electric |
Air Sealing |
Wrap
with tape flashing
Marriage
line gasket (new product)
Penetrations
sealed with foam insulation
|
Wrap
without tape flashing
Standard
practice marriage line sealing
|
Air/Vapor Barrier |
Walls
and Ceiling: Painted Drywall
Floor:
Floor decking
|
Same |
Data logger collects 15 minute data from wired sensors and
transmits daily to the host computer at FSEC via modem. Summary
data reports are available at www.baihp.org under “Current
Data.” Plug-type loggers were installed in mid March
2003 to sub-meter the energy use of the refrigerator, freezer
and clothes washer in each home, as well as the radiant heat
panel and HRV in the ZEMH. Data from these loggers was collected
by occupant readings in mid-December 2003.
Preliminary findings
Measured
net energy use of the ZEMH 6% is lower than the base home,
not normalized for occupant behavior. This also does not
take into account the fact that the ZEMH’s
PV system was only fully operational for one month.
The ZEMH required 45% less space heating energy, possibly
due to improved building envelope measures, and the lack
of consistent HRV operation.
The measured envelope leakage in the ZEMH was 2.0 ACH50,
much lower than the base home (indeed, lower than any other
NEEM home tested in the field) and substantially tighter
than typical HUD code homes.
The ZEMH total duct leakage was 46% lower than the base
home; leakage to the outside was 405% lower than the base
home. The BAIHP staff speculates that the unprecedented low
leakage to the outside value is the result of the ducts in
the ZEMH being located within the conditioned space, and
effectively within the pressure envelope of the home, surrounded
as they are by foam insulation.
The solar water heating system in the ZEMH provides most,
if not all of the hot water needed during the summer months,
and roughly 45% of the total hot water demand. The PV system
with net metering provides 38% of the total ZEMH energy use.
The
project highlights the importance of occupant choices and
behavior on the performance of energy efficient housing.
Based on the preliminary monitoring data and occupant surveys,
the behavior patterns of the ZEMH occupants are not themselves “energy
efficient”. These patterns create the appearance of
a less efficient home. On the other hand, the behavior of
the ZEMH occupants may shorten the payback for the innovative
technologies of the ZEMH.
BAIHP staff also performed a benchmarking analysis on the
ZEMH, as part of the overall benchmarking effort. The ZEMH
reached a level of 60% above the NREL prototype, which indicates
the difficulty of obtaining a high benchmarking score.
- Manufactured Housing Indoor Air Quality Study
In the spring of 2003, BAIHP initiated a study with Palm
Harbor Homes (PHH) to evaluate the energy savings from a
Building America Manufactured Home, compared to a standard
Palm Harbor Home.
These
two homes were built in the fall and set up on PHH’s
model center in Plant City, Florida.
The monitoring plan called for measurements of volatile
organic chemical (VOCs) levels, air conditioning energy use
and associated indicators such as indoor and outdoor conditions.
Both homes have split system air conditioners, SEER 15 in
the BA model, and SEER 10 in the Base Case model.
The two homes were instrumented in November, however, due
to a PHH phone service conflict, no data was taken during
this budget period. Data collection is expected to commence
in May of 2004.
VOC measurements were conducted in collaboration with LBNL.
The VOC data revealed significantly higher VOC levels in
the Building America home than in nearby control models of
a similar age. Normally, PHH would move furniture in from
a previous model, but in an effort to ensure high quality
in the BA model, PHH purchased all new, all wood furniture.
This is believed to be the source of VOCs in the BA model.
BAIHP and LBNL researchers will work to verify what caused
the elevated VOC level in the next budget cycle.
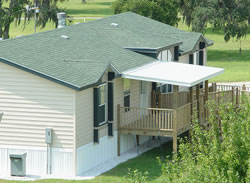
- Manufactured Housing Laboratory – Ventilation
Studies
Ventilation Study
The MHLab (Figure 47) is a research
and training facility of 1600 ft 2. This Energy Star® manufactured
home has two separate heating and cooling systems:
1. An overhead duct system connected to a package unit air
conditioner with electric resistance heating.
2. A floor-mounted duct system connected to a split system
air conditioner, also with electric resistance heating.
Only the floor mounted duct system was used in these ventilation
experiments.
Introduction
|
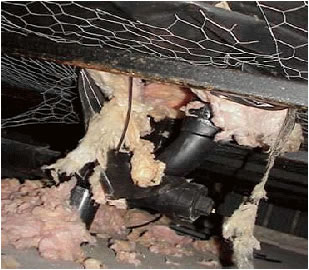
Figure 47 Manufactured Housing Laboratory
at FSEC (above and below) was site for study of six
residential ventilation systems. |
|
Ventilation is a HUD code requirement. The goal of ventilation
is to add fresh air to the home. This may be accomplished
by supplying outside air to the house or mechanical system,
exhausting air from the house (which consequently pulls air
into the house through joints in the walls, floor, and ceiling),
or a combination of the two.
Supply based ventilation tends to slightly pressurize the
home whereas exhaust based ventilation does the opposite
slightly depressurizing the house. The disadvantage of supply
based ventilation is that it forces conditioned air into
the floor, wall, and ceiling cavities, possibly leading to
condensation or mold growth in cold climates and during the
heating season. Likewise the disadvantage of exhaust systems
is that they pull unconditioned outside through the floor,
wall, and ceiling cavities into the conditioned space, possibly
leading to condensation, mold growth, or uncomfortably high
indoor humidity levels in hot and hot-humid climates and
during the cooling season. The six residential ventilation
strategies evaluated are described in Table 25.
House Operation and Experimental Procedure
Occupancy Simulation: Automated, computer controlled
devices, such as appliances, showers, and lighting, simulate
the sensible/latent heat generation and carbon dioxide (CO
2) production of a family of four persons with periodic showers,
cooking and cleaning.
The simulated latent occupancy load from breathing,
bathing, cooking, and laundry was achieved by adding 14 to
15 pounds of water per day based on documentation of "average" household
operation based on ORNL research conducted by Jeff Christian.
Water vapor was injected into the space using a vaporizer at
a rate of approximately 0.4 lbs per hour continuous and an
additional 0.4 lbs per hour during the evening hours.
Table
25 Ventilation Strategies Studied in the MHLab |
Case
(Name)
|
Strategy |
Description |
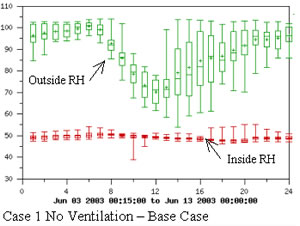
# 1
(None).
|
No mechanical ventilation |
Base Case scenario included only the
heating and cooling system of the home with no outside
air (OA) ventilation. |
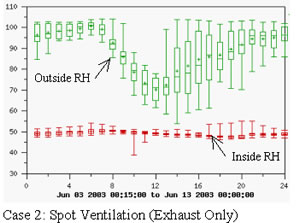
# 2
(Spot)
|
Spot ventilation (exhaust only) |
Bathroom and kitchen exhaust fans.
Operation scheduled for 30 minutes after a simulated
moisture producing event such as a shower or oven use. |
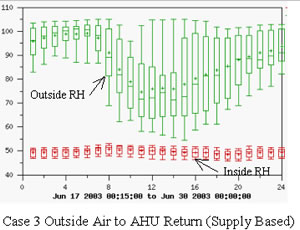
# 3
(OA)
|
Outside air (supply based) |
Dedicated, filtered outside air duct
to return plenum when the heating or cooling system
is operating. Quantity of ventilation air provided
depends on air handler run-time. |
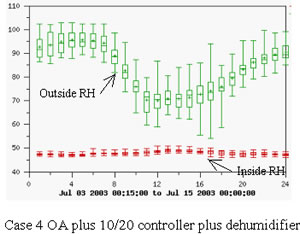
# 4 (Dehumid) |
Outside Air plus 10/20 Cycle and Dehumidification
(Supply Based) |
Same
as #3, except with an added air handler fan controller
(10-minute “on” -
20-minute “off” minimum duty cycle). Provides
scheduled ventilation when no cooling or heating is
called for. A stand alone room dehumidifier (set to
approximately 50% RH) located in vicinity of the return
air grill. |
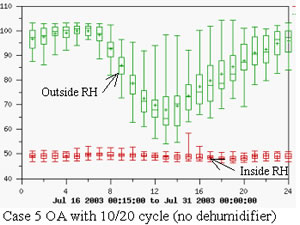
# 5
(10/20 Cycle)
|
Outside Air plus 10/20 cycle (Supply
Based) |
Same as #4, except without the room
dehumidifier. |
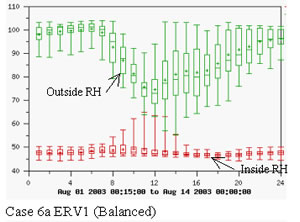
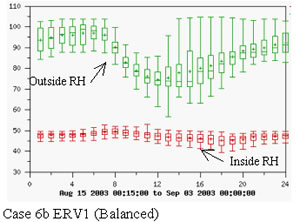
# 6 (ERV1) (ERV2) |
Energy recovery ventilator (ERV1, ERV2) |
Two different enthalpy transfer media
were used. Outside air was drawn in through the ERV
at a rate to meet the ventilation requirements. |
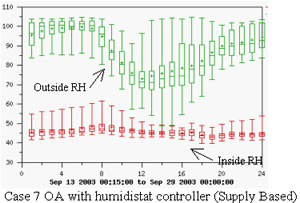
# 7
(Hstat)
|
Outside Air plus Humidistat (Supply
Based) |
This is a modified air handler fan
speed control. When dehumidification is needed, the
air handler fan is operated at lowest speed for enhanced
latent control. A higher speed is selected when sensible
cooling is needed. Ventilation air supplied via an
outside air duct, with air handler fan operation controlled
as in #4. |
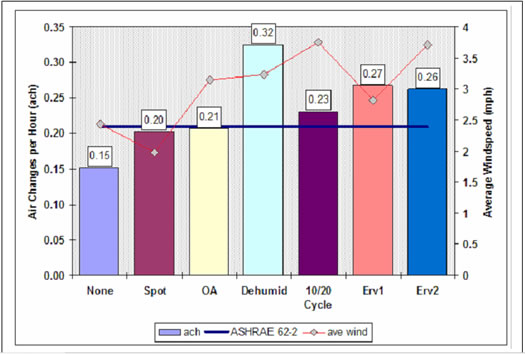
Ventilation Rate: Researchers conducted whole house
air tightness tests using sulfur hexafluoride as a tracer gas
for a decay analysis (Figure 48) to determine if each
ventilation strategy met the ASHRAE 62-2 Ventilation Standard
during the test period. The spot ventilation strategy (#2)
did not meet the standard on a daily basis as the runtime was
not long enough. The outside air method (#3) was marginal in
meeting the standard. Strategies #4-#7 met the standard.
|
Figure
48 Results of
tracer gas decay testing indicating operational
infiltration
(house not under test pressure) rates measured for each ventilation strategy.
ASHRAE Standard 62.2 was the target ventilation rate, not met by Spot
or
OA strategies. Note: Wind speed averaged over 2 hour infiltration test. |
Whole House and Duct Air Tightness: The average
whole house air leakage (CFM50) was 1224 (ACH50 of 5.4).
The target normalized duct leakage is Qn #6%, where Qn=CFM25/conditioned
area, this is the same as the duct leakage target in the
Manufactured Home Energy Star program. The total duct system
leakage in the MHLab Qn total=5% (CFM25 total = 75) with
leakage to the outside measured to be Qn (out)=3% (CFM25
out = 45), well under the leakage target.
Interior temperature and relative humidity: A digital
thermostat maintained interior temperature at 75 degrees
Fahrenheit. Interior temperature and relative humidity
sensors are located on the same wall as the thermostat, at
approximately the same height from the floor. Dedicated interior
relative humidity control was only available with the dehumidifier
strategy, and was a byproduct of cooling coil operation
in the other strategies.
Cooling/ventilation power usage
With all mechanical ventilation systems, additional energy
use from both increased conditioning loads and fan (if present)
power is expected. The split system with the floor duct system
is a 12 SEER system with a rated cooling capacity of 30.2
kBtu. The ventilation strategies that required the use of
the air handler fan, an energy recovery ventilator, or the
dehumidifier had the energy use added to the cooling energy.
The dehumidifier strategy did use the most energy for cooling;
however, it should be noted that this test occurred during
the hottest ambient conditions.
Table
26 Average Ambient and Building Conditions |
|
Case 1 None |
Case 2 Spot |
Case 3 OA |
Case
4 Dehumid |
Case 5 10/20 |
Case 6 ERV1 |
Case 6 ERV2 |
Case 7 Hstat |
Indoor
Temp (°F) |
74.5° |
74.5° |
74.7° |
74.9° |
74.0° |
74.1° |
74.4° |
74.8° |
Indoor
Temp Max (°F) |
75.0° |
75.2° |
75.5° |
76.0° |
75.0° |
74.9° |
75.4° |
76.0° |
Indoor RH (%) |
49.2% |
45.7% |
49.5% |
47.9% |
49.1% |
47.8% |
47.2% |
45.7% |
Indoor
Dewpoint (°F) |
52.4° |
54.2 |
54.5 |
53.9 |
53.7 |
53.1 |
53.0 |
52.4 |
Outside
Temp (°F) |
78.6° |
78.6° |
78.4° |
82.1° |
79.8° |
79.3° |
80.8° |
79.2° |
Outside RH (%) |
89.2% |
79.5% |
87.7% |
83.4% |
87.0% |
90.0% |
86.9% |
88.1% |
Δ Temp (°F) |
4.3° |
4.0° |
3.7° |
7.1° |
5.8° |
5.1° |
6.5 |
4.4 |
Δ Dewpoint (°F) |
18.6° |
20.7° |
19.5° |
22.4° |
21.4° |
22.7° |
23.3° |
22.6° |
Solar Rad. (kWh/m 2) |
53.5 |
107.3 |
68.9 |
76.3 |
86.8 |
66.3 |
101.9° |
77.1° |
Rainfall (Inches) |
3.6 |
0.5 |
4.7 |
0.1 |
4.0 |
5.1 |
3.2 |
4.9 |
Condensate (lbs) |
617 |
905 |
920 |
1131 |
1118 |
1034 |
1685 |
1282 |
Δ P
WRT Out (Pa) |
-0.2 |
0 |
0.1 |
0.4 |
0 |
-0.2 |
-0.2 |
0.1 |
Minimum RH |
42.1% |
38.8% |
45.8% |
46.2 % |
46.3% |
44.2% |
39.3% |
39.7% |
Maximum RH |
53.3% |
55.2% |
53.2% |
51.0 % |
58.4% |
64.8% |
53.0% |
61.4% |
Mean RH |
46.1% |
49.2% |
49.5% |
47.9 % |
49.0% |
47.8% |
47.2% |
45.7% |
RH Standard Deviation |
1.272 |
1.471 |
1.673 |
0.845 |
1.231 |
2.194 |
2.108 |
3.07 |
RH Range |
11.2 % |
16.3 % |
7.4 % |
4.8 % |
12.1 % |
20.6 % |
13.7 % |
21.7 % |
Findings
The
cooling energy required to maintain the 75°F interior
set-point appeared to vary as a result of the temperature
difference across the envelope (Table 26). A linear regression
analysis was performed to compare energy use of the ventilation
strategies as a function of temperature difference across
the envelope (Table 27). The power use at the average temperature
difference of five degrees Fahrenheit is shown in bold.
- Case 4, the dehumidifier system, has the highest average
power at 1592 watts.
- Case 7 (humidistat controlled fan speed or Hstat) is
second highest at 1485 watts.
- Case 5 (10/20 cycle controller) used the least power
at 1315 watts.
As might be expected, interior relative humidity had the
least variance with the dehumidification system with a low
of 46% and a high of 51% (Table 26 and Figure 49).
The best performing system, Case 4 (10/20 cycle plus dehumidifier),
was able to maintain the relative humidity at a nearly constant
level for almost 80% of the test period. The next best performer
was Case 2 (spot ventilation). Humidity levels during the
test period are graphed in Figure 49.
Table 27
Cooling and ventilation power (watts) usage as a function
of temperature difference across the building envelope |
ΔTemp
(°F) |
Case
1 None |
Case
2 Spot |
Case
3 OA
|
Case
4 Dehumid |
Case
5 10/20 |
Case
6 |
Case
7 Hstat |
ERV1 |
ERV2 |
-5 |
487 |
499 |
475 |
499 |
411 |
459 |
367 |
526 |
0 |
924 |
911 |
949 |
1046 |
863 |
915 |
880 |
1006 |
5 |
1361 |
1324 |
1424 |
1592 |
1315 |
1370 |
1393 |
1485 |
15 |
2236 |
2150 |
2372 |
2685 |
2219 |
2280 |
2418 |
2443 |
Figure
49 Average
hourly relative humidity profiles for each
strategy |
|
|
|
|
|
|
|
|
Conclusions
The
operation of a correctly sized air conditioning system
with a supplemental dehumidification system to pre-condition
the outside air and provide additional dehumidification of
the space appears to provide the best interior humidity control
(Table 26, in bold) with only a slight increase in energy
usage – about 200 watts (Table 27). This is represented
by Case 4 of this study. Only this strategy was able to maintain
the interior humidity conditions in a range of less than
5% (Table 27, in italics).
Though
all of the strategies did provide some humidity control
over the test period, it is most likely a result of the
run time afforded by the correctly sized air conditioning
system and the consistent simulated interior sensible load.
When an air conditioning system operates for extended periods
of time, the removal of moisture from the air stream is
enhanced (Khattar, Swami & Ramanan
1987).
Additional
testing with other ventilation strategies in the MHLab
will be undertaken in the next budget period.
|


 You
are here:
You
are here: 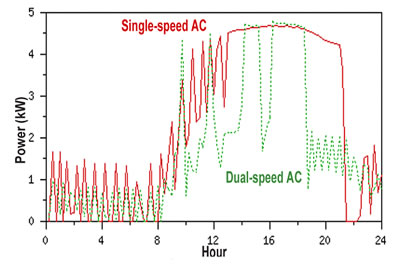

