- Manufactured
Housing Energy Use Study, North Carolina A&T
Side-by-side
monitoring of two manufactured homes at North Carolina
Agricultural and Technical State University (NCA&TSU),
evaluated the value of a variety of energy saving technologies
and techniques. (Figure 50 and Table 28) Home instrumentation
measured energy consumption as well as interior and exterior
climatic conditions. The “standard home,” designed
and built to basic HUD code requirements, represented the
control home. Modified to use at least 50% less energy, the “energy
home” met Building America standards. Cooperating researchers
at NCA&TSU and FSEC investigated energy feature performance
and compared actual energy used to energy modeling program
predictions. In-situ energy performance data provided researchers
with interesting information on both issues.
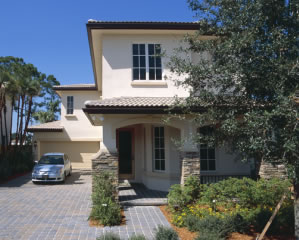
|
Figure 50 Side-by-side
monitoring of
manufactured homes at NCA&TSU. |
Each
model contained 1,528 ft 2 of living area with nearly identical
floor plans. Though the homes were unoccupied during the
testing, home lighting and water heating use was simulated
with timers. A datalogger in each home recorded: (1) the
interior and exterior temperature and humidity along with
solar radiation and wind speed, (2) the home’s total
power consumption, (3) the air conditioning/heat pump compressor,
air handler fan, and electric resistance heater use (primary
heater in the standard house, backup or emergency heater
for the energy house), and (4) water heating and water usage
data.
The energy house features combined higher insulation values,
improved windows, centralized and airtight duct design, high
efficiency heat pump, and a solar water heater. Feature-by-feature
construction differences are highlighted in Table 28.
Table
28 Specifications of Standard and Energy Construction |
Characteristic |
Standard House |
Building America
House |
square footage |
1528 |
1528 |
floor insulation |
R-11 |
R-22 |
wall insulation |
R-11 |
R-13 |
ceiling insulation |
R-20 |
R-33 + roof deck radiant
barrier |
windows |
single pane with interior
storm |
low-E double pane |
exterior doors |
storm door on front |
storm door on all |
marriage wall seal |
fiberglass pad |
sof-seal gasket |
heating system |
resistance electric |
heat pump HSPF 7.5 |
cooling system |
central air conditioning
SEER10 |
central heat pump SEER12 |
system size |
3 tons |
2 tons |
water heating |
electric
water heater – 40
gallon |
solar
water heater – 66
gallon |
duct joints |
industry standard |
sealed with mastic |
duct leakage |
*CFM5out = 145 |
CFM25out = 83 |
house leakage |
**ACH50 = 10 |
ACH50 = 9 |
*Cubic
feet per minute
**Air changes per hour |
Data collection on the two homes began in early January 2001
and continued through this reporting period. Palm Harbor Homes
in Siler City manufactured both homes, the results for program
year three and four are detailed below.
Year 4 Side-by-Side Monitoring Results
During
Phase 2, modifications were made to the solar water heating
system in the energy efficient housing unit to help improve
the performance this system. Further, a number of the incandescent
light bulbs in the energy unit were replaced with compact
fluorescent bulbs. These changes were staged to allow an
evaluation of the effect of each measure on the home’s
energy use.
Based on investigative results, it can be concluded that:
- Changes
in the building envelope, HVAC and duct systems, and fenestrations
in the energy home met researchers’ 50%
energy use reduction goal. Measured annual energy savings
for heating and cooling energy was 58%, and 53% for heating,
cooling, and hot water production.
- Care
should be exercised in the manufactured housing unit
setup or relatively minor construction deficiencies can
significantly reduce a home’s energy efficiency.
Many of these items are invisible to the homeowner; therefore
procedures must be developed to ensure that deficiencies
do not occur during setup.
- The
Energy Gauge energy analysis program appears to give
a reasonably accurate prediction for expected energy use
reduction in a typical manufactured housing configuration.
The predicted energy savings for the housing units evaluated
in this investigation ranged from 54% to 63%, while the
measured values ranged from 53% to 58%. Version 2.0 of
the Energy Gauge Program provided a more accurate energy
savings prediction than the older software versions.
- An
increase in pipe and tank insulation can increase not
only the energy efficiency of a solar water heater by reducing
stand-by losses, but also can reduce the cooling load in
a manufactured housing unit and increase the overall energy
efficiency of the water heating unit. Even small amounts
of exposed piping can significantly affect the energy efficiency
of the water heating system.
- While
providing essentially the same lighting levels, replacing
incandescent lamps with compact fluorescent bulbs not
only reduces lighting energy use, but also reduces the
home cooling load.
The total measured energy used by each of the housing units
for cooling and heating are shown in tables below. Table
29 shows the energy used for heating and cooling the standard
housing unit from January through August of 2002. The standard
home datalogger was struck by lighting in mid-August 2002.
Data after this point was not included since only partial data
is available and performance comparisons were not possible. Table
30 shows a summary of the cooling and heating energy used
by the energy housing unit. Tables 31 and 32 list
the energy use for hot water production for the standard and
energy units, respectively.
Table
29 Cooling and Heating Energy Use, Standard House Actual
Values (kWh) |
|
SEP |
OCT |
NOV |
DEC |
JAN |
FEB |
MAR |
APR |
MAY |
JUN |
JUL |
AUG |
Phase
1 |
492.4 |
447.6 |
648.6 |
1741.1 |
2495.3 |
849.6 |
628.8 |
384 |
566.3 |
990.8 |
852.9 |
1066 |
Phase
2 |
|
2120.2 |
1717.1 |
1227.6 |
502.0 |
438.0 |
939.4 |
1079.4 |
511.2 |
Table
30 Cooling and Heating Energy Use, Energy Star House |
|
SEP |
OCT |
NOV |
DEC |
JAN |
FEB |
MAR |
APR |
MAY |
JUN |
JUL |
AUG |
Phase
1 |
337.3 |
205.7 |
150.8 |
452.8 |
1087.3 |
472.8 |
426.9 |
184.8 |
528.3 |
891.5 |
850.9 |
671.6 |
Phase
2 |
|
680.7 |
537.1 |
378.1 |
241.9 |
311.8 |
603.0 |
668 |
626.6 |
Table
31 Domestic Hot Water Use, Standard House |
|
SEP |
OCT |
NOV |
DEC |
JAN |
FEB |
MAR |
APR |
MAY |
JUN |
JUL |
AUG |
Phase
1 |
197.8 |
267.7 |
250.2 |
212.6 |
0 |
0 |
217.6 |
244.9 |
258.1 |
227.5 |
207.9 |
213.5 |
Phase
2 |
|
294.6 |
280.9 |
283.2 |
264.9 |
280.2 |
192.2 |
200.3 |
85.2 |
Table
32 Domestic Hot Water Use, Energy Star House |
|
SEP |
OCT |
NOV |
DEC |
JAN |
FEB |
MAR |
APR |
MAY |
JUN |
JUL |
AUG |
Phase
1 |
133.4 |
176.2 |
204.2 |
189.9 |
0 |
0 |
245.5 |
184.4 |
183.0 |
141.2 |
152.3 |
126.6 |
Phase
2 |
|
251.1 |
212.0 |
202.8 |
145.9 |
157.3 |
74.8 |
80.3 |
83.0 |
Also
listed in each table are the monthly energy use values measured
during the first phase of this investigation, January through
August 2001. Please note that the energy housing unit data
prior to August 2001 is suspect due to duct and HVAC system
problems later corrected. The entire data set, including, temperature,
relative humidity, solar radiation, and power use is listed
on the FSEC web site www.infomonitors.com.
The total energy used for water heating and central cooling
over the period of August 1 through August 15 was 363.5 kWh
for the energy home and 596 kWh for the standard home. This
represents a 40 % reduction in energy use between the two homes.
The total energy used over the period of August 1 through
August 15 for water heating was 27.13 kWh for the energy house
and 85.18 kWh for the standard home. This represents a 68%
reduction in energy use with the solar water heating system
and compares well with the June and July reductions of 63%
and 60%, respectively. Consistent findings indicate that the
tank and piping insulation has reduced the standby tank losses
and improved the solar water system efficiency.
In the energy housing unit, three of the 100 watt incandescent
lamps that were on the evening four-hour timed duration were
exchanged for 25 watt compact fluorescent lamps on June 4th.
This change did appear to have a small effect on the cooling
load in the energy housing unit. The relative cooling energy
used by each of the housing units from June, 2002 through August
2002 showed a small change. The percentage reduction in cooling
energy used by the energy housing unit increased from about
30% to 38%. However, it is difficult to isolate the effects
of the improvements in the solar water heating system insulation
and the effects of the compact fluorescent bulbs. In any event,
these effects appear to be much smaller than that produced
by the hot water system changes.
Year
3 Side-by-Side Monitoring Results:
|
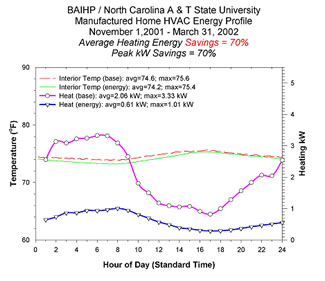
Figure 51 Heating
season consumption
and savings for side by side study
of
Energy Star Manufactured Housing. |
Heating
system savings (2001 to 2002) were a remarkable 70% during
Phase 1. Cooling energy season savings were 36%, less than
heating but still very substantial. The combined heating,
cooling, and water heating savings were 52% for a 9-month period. (Figure
51)
In
addition to the energy monitoring effort, NCA&TSU
researchers investigated the feasibility of replacing the conventional
framing/envelope used in manufactured/industrial housing with
alternative systems. Included in this evaluation, was an analysis
of the energy impact of using aerated autoclaved concrete (AAC)
flooring systems and structural insulated panels (SIP) to supplant
traditional wall and roofing
systems. The economic viability
of using AAC blocks for structural skirting /foundation around
the model units also was evaluated.
Analysis’ results
determined:
The best manufactured home energy performance can be achieved
using the SIP wall and roof systems with the AAC plank. This
performance can be further enhanced with an R-8 unvented
crawl space. Though a manufactured home performs best with
these alternative systems, the cost to include them may not
make economic sense.
- AAC planks can be designed to replace both the steel frame
and flooring systems for HUD code manufactured housing units
and modular units. These planks also can be modified to incorporate
built-in insulated ducts.
- AAC planks are pre-manufactured and require less assembly
labor than a typical stick framed unit, but including the
plank flooring would increase framing costs by 28%. The heavier
weight of an AAC system might exacerbate high framing costs.
Similarly, comparative analysis results found that replacing
a conventional framing system with a SIP system would increase
framing costs by 66%.
- At the current prices for energy and wood products, neither
the AAC plank system nor the SIP systems are as economically
effective as improvements in the current conventional HVAC
systems, steel and wood framing, sheathing systems, and air
barriers with respect to improving energy performance.
- The use of AAC planks has the potential to be economically
viable in the modular housing market, especially if used
with sealed crawl space foundation systems, where their improved
resistance to moisture degradation would be very important.
- SIP wall and roof systems also could prove to be economically
viable if the price of wood energy increases, and the SIP
manufacturing costs decrease through large volume purchases.
- The
proposed AAC planking system presents a system that is
significantly less affected by water and moisture degradation
and may be effective in reducing manufactured housing units’ susceptibility
to flood damage. These systems also are not susceptible to
termite attack.
- The
savings from reduced transportation damage from greater
durability and increased floor system stiffness were not
addressed in this investigation. It wouldn’t take
many days of damage repair (at about $300/person-day for
personnel costs related to transportation) to vastly improve
the economics of these alternative systems.
- Portable Classrooms
Project Overview
This is primarily a WSU (with subcontractors Oregon and Idaho)
and Pacific Northwest National Lab (PNNL) task. Other partners
include FSEC, UCFIE, the State Energy Offices of Oregon and
Idaho, school districts in Portland, Oregon, in Boise, Idaho
and Marysville, Washington, regional utilities, manufacturers,
and other stakeholders in the Pacific Northwest.
The objective of this task is to promote the adoption of
energy efficient portable classrooms in the Pacific Northwest
that provide an enhanced learning environment, high indoor
air quality, and both substantial and cost-effective energy
savings. BAIHP staff focus on four main goals: (1) offering
technical assistance to portable classroom manufacturers, school
districts, and related organizations, (2) field assessment,
monitoring, and analysis of innovative building technologies
and energy saving features to determine their value, (3) facilitation
of collaborative agreements among regional utilities, northwestern
portable classroom manufacturers and materials and equipment
suppliers, as well as school districts, and state education
departments and their affiliates, and (4) conducting and creating
educational opportunities to advance the widespread adoption
of energy efficient portable classrooms in school districts
nationwide.
The experiences working on the energy efficient portable
were instructive, particularly in the identification of flaws
in portable classroom design. The difficulties that BAIHP staff
encountered demonstrate the importance of well-defined commissioning
protocols, documentation, and coordination among all personnel
that service and install HVAC equipment.
Findings:
- Portable classrooms in the Pacific Northwest are occupied
about 1225 hours per year, or about 14% of the total hours
in a year.
- The
average number of occupants in the standard 28’ x
32’ portable classroom provide an internal heat of
about 480 kWh/year, or 8% to10% of space heating requirements.
- Most of the heat loss in portable classrooms manufactured
after 1990 occurs by air leaking through the T-Bar dropped
ceilings, because they have no sealed air/vapor barrier.
This newly created phenomenon occurred with the incorporation
of the less expensive dropped T-Bar ceiling in place of the
more expensive sheet rock used in older portables. Air leakage
also is increased because of unsealed marriage lines - now
used as a low cost method of meeting the state attic ventilation
requirements.
- Since all portables tested in the project used a simple
seven-day programmable thermostat, the HVAC systems operate
during vacations and holidays.
- Energy codes in Washington, Oregon, and Idaho are high
enough to make beyond-code envelope measures non cost-effective.
- Older portable classrooms under removal consideration
could be retrofitted with new energy efficiency measures
at much less cost than purchasing a new portable classroom.
Installing low-E, vinyl framed windows, insulated doors,
T-8 light fixtures, and caulking and sealing air leaks can
all be cost-effective when refurbishing older portable classrooms.
HVAC system replacement in older portable classrooms will
be the biggest single cost item, ranging from $4500 to $6500.
- CO 2 sensors appear to be unreliable as a control strategy.
Those installed by field crews and monitored by dataloggers
in this study did not match the readings shown by the CO
2 sensors which controlled the ventilation systems.
Based on data analysis from years one through four, the following
measures were recommended. New portable classroom procurement,
setup, and commissioning as well as existing classroom retrofit
guidelines produced by the BAIHP study can all be found in
Appendix A.
Recommendations:
- Install 365 day programmable thermostats in all existing
portables and specify these thermostats for new construction.
- In portable classrooms constructed with T-Bar dropped
ceilings, install an air/vapor barrier above the T-Bar system
on the warm side of the insulation. Completely seal all edges
and overlaps.
- If roof rafter insulation is used, seal the marriage line
at the roof rafter joint with approved sealant such as silicon
caulk or foam. Make sure there is adequate ventilation between
the insulation and the roof.
- Conduct an audit of older portables scheduled for disposal
to determine if retrofitting would be more cost effective
than purchasing a new unit.
- Install occupancy sensors to control the ventilation system.
- Specify that new portables contain windows on opposing
walls.
- Specify that new portable units contain exhaust fans on
the opposite side of the classroom from the fresh air supply.
School
Partnerships
|
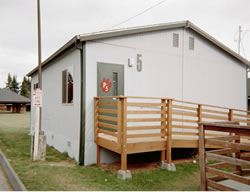
Figure 52 64Energy
efficient portable classroom at Pinewood Elementary
School in Marysville, Washington |
|
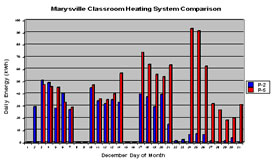
Figure 53 Graph
comparing heating system
use of the Pinewood control
portable (P2-Blue) with the energy efficient portable
(P5-Red). Note the energy efficient portable’s
high energy use during the Christmas holidays due to
incorrectly configured heating system controls. |
|
Figure
54 Ventilation
system testing
at North Thurston School District. |
An 895 ft 2 portable classroom (P5) was sited at the Pinewood
Elementary School in Marysville Washington in August 2000.
This unit exceeded current Washington State Energy Code standards
with upgraded insulation in the floor, roof and walls, low-E
windows, and a sensor-driven ventilation system that detects
volatile organic compounds (VOCs). A second portable, built
in 1985, and also located at Pinewood Elementary (P2), served
as the control unit. (Figure 52.)
Energy
use comparisons of the two classrooms show that the energy
efficient portable used considerably more energy than the control
portable. This was attributable to several factors:
- Incorrect
wiring of the exhaust fan, causing it to run continually.
The fan was rewired in 2000 during the summer break. Once
corrected, energy use in the portable declined.
- Incorrect
programmable thermostat settings which were not programmed
to turn the heating and cooling system off during holidays
and vacations. Though energy use was reduced when the portable
was unoccupied, use was still excessive (Figure 53).
- Higher
air leakage in the energy efficient portable than
the control portable. Blower door testing found 19
ACH at
50 Pa in the energy efficient classroom compared to nine
ACH at 50 Pa in the control classroom. Follow-up blower door,
smoke stick, and APT pressure tests indicated that the predominant
leakage path tracked through the T-bar ceiling and into the
vented attic due to an ineffective air barrier in the energy
efficient portable. The control portable contains taped ceiling
drywall.
- No
initial HVAC commissioning by the HVAC supplier or the
school district.
- Significant
HVAC system alterations (including rewiring, ventilation
system VOC sensor replacement with a CO 2 sensor, and modifications
to other aspects of the HVAC control system) during 2001
by maintenance staff and the HVAC supplier, unbeknownst
to BAIHP staff. Calibration testing done by scientists at
the Florida Solar Energy Center on the CO 2 sensors showed
significant drift in output results. This made data collected
virtually unusable.
- The
use of plug-in electric heaters during the winter of 2001
by the resident teacher because of room comfort problems.
This led to significant room temperature variations and monitoring
data showed high plug-load energy use.
- Poor
fresh air flow design with the fresh air intake and exhaust
fan positioned so they create a “short circuit” of
fresh air, bypassing the students and teacher.
BAIHP
staff proposed the following recommendations to Pinewood
Elementary:
- Well-defined commissioning protocols, documentation, and
coordination among all personnel that service and install
the HVAC equipment. This is a critical component of efficient
and healthy classroom operation and should include outside
airflow rate measurements to assess adequate ventilation
and control testing to insure correct system operation.
- Design changes to the portable classroom manufacturer,
including the use of a structural insulated panel system
(SIPS), tighter ceiling barrier and sheetrock ceilings, elimination
of the vented attic, and relocation of the exhaust fan to
the wall opposite the supply air vent.
- Removal
of current HVAC controls and replacement with both an occupancy
sensor-driven control for the ventilation system and a heating
system programmable thermostat. Staff also proposed a classroom
on/off switch to simplify the system turnoff during unoccupied
summer and school vacations.
- Location of exhaust fans in future portables on the wall
opposite the supply air vent.
- Window installation on opposing sides of the classroom
to increase daylight penetration and to assist in passive
cross-ventilation.
Based
on the above recommendations, WSU researchers worked with Marysville
school facility manager and customer representatives from Snohomish
Public Utility District to assist them in setting new construction
specifications for 13 portable classrooms they will procure
during the next reporting period. Marysville School District
will specify a completely sealed ceiling barrier, a new model
heating/ventilation system, a 365 day programmable thermostat,
window placement on opposite sides of the classroom, and exhaust
fan placement on an opposite wall from the fresh air supply.
Washington Schools - North Thurston School District
BAIHP staff also worked with the North Thurston School District
to troubleshoot a portable classroom in Lacey, Washington.
(Figure 54) The classroom was experiencing high energy
use and poor indoor air quality. BAIHP staff tested the classroom,
made recommendations including opening the supply dampers,
installing a wall side vent to better ventilate the classroom
and discussed the specification development process with district
staff. The North Thurston School District now is including
most of the measures listed in the new procurement guidelines
for their future portable classroom purchases. The school district
will investigate the feasibility of installing an air/vapor
above the T-bar dropped ceiling and will record costs for making
these improvements.
Idaho Schools - Boise School District Retrofit
BAIHP staff located a portable classroom at the West Boise
Junior High School in the Boise Idaho School District, occupied
by a teacher who was interested in having the classroom monitored
and retrofitted. The teacher also is an Idaho State legislator
active in education issues, which staff members believe will
increase the chances of implementing the final recommendations.
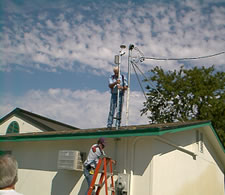
(Figure 55)
|
Figure 55 Weather monitoring
system installation in the Boise portable classroom. |
BAIHP
staff performed a baseline audit, and installed monitoring
equipment to track the classroom’s
energy use during 2000. In 2001, the classroom was retrofitted
with an efficient HVAC system (controlled by CO 2 sensors),
lighting, and envelope measures. The classroom was then reaudited,
and monitored for the remainder of the year.
BAIHP staff worked with Pacific Northwest National Laboratories
(PNNL) on the pre- and post-retrofit audits, and installation
of the monitoring equipment. In their capacity of
providing
energy management services to the school district, the local
utility Avista Corporation, collected lighting and occupancy
data.
Monitoring data indicates a 58% reduction in energy usage
post-retrofit. Blower door tests indicate a reduction in air
leakage from nine ACH at 50 Pa to five ACH at 50 Pa. Data also
revealed that heating use actually increased on weekends and
holidays because of lack of internal heat gain and because
the HVAC control systems are not programmed to shut off on
weekends and holidays. The total retrofit cost was $9,892.
Monitored data suggests that the CO 2 sensor that controls
the HVAC system is not correctly configured. The system does
seem to react to an increase in CO 2 levels early in the day,
but does not remain on; CO 2 levels only begin to significantly
dissipate after one o'clock PM. BAIHP researchers have noted
the difficulty of correctly configuring these sensors in other
monitored classrooms.
Oregon Schools
Oregon BAIHP staff worked with the Portland Public School
District to procure two energy efficient classrooms. These
were constructed to BAIHP staff specifications and included
increased insulation, high efficiency windows, transom windows
for increased daylighting, a high efficiency heat pump, and
efficient lighting. Staff videotaped the construction of one
classroom.
Monitoring equipment was installed by PNNL staff. Estimates
using the software Energy-10 indicated a total energy consumption
of 9200 kWh, or $583 per year at Portland energy rates. Measured
results showed the Oregon portable used about 6600 kWh for
the monitored period.
Incremental costs for the energy efficiency measures were
$6,705 over Oregon commercial code, including approximately
$2,500 for the HVAC system. This suggests a simple payback
of 10 to12 years.
Initial blower door tests found air leakage rates of 11.3
ACH at 50 Pa. BAIHP staff also identified significant leakage
through the T-bar dropped ceiling and up through the ridge
vents. Other monitoring results indicated that the same HVAC
control problems exist with the Oregon classroom as with the
others studied in this project.
The
Energy Efficient model outperformed code level models in
the Portland area. The older the classroom, the more energy
consumed. Even when compared with new code level models from
the same year, the Energy Efficient model used 35% less energy.
Conventional code level classrooms do not include energy
efficient measures which greatly increases the unit’s operating
costs. Classrooms built more than 10 years ago, use twice
as much energy as the efficient model. Those older than 20
years consume more than three times the amount of energy.
From this study, researches determined that high performance
classrooms can save anywhere from $200 to $1000 dollars a
year in energy costs compared to older, less efficient portables.
A survey sent to teachers and maintenance staff indicates
a high degree of satisfaction with the efficient portables;
the teachers were most impressed with the improved indoor air
quality and increased light levels due to the daylighting windows.
Historical Data Collection
In Idaho, Oregon, and Washington, BAIHP staff worked with
local utilities and school districts to obtain historic energy
use data on portable classrooms. This data will be used to
compare energy usage from the energy efficient portables monitored
in this study.
In Idaho, BAIHP staff worked with Avista Corporation's energy
manager to collect historic data on 14 portable classrooms
in the Boise School District. The classrooms each were equipped
with discrete energy meters; as a result, BAIHP staff was able
to obtain energy usage data for the past three to four years.
A procedure was developed to collect information on portables
at each school in cooperation with the physical facilities
manager and each school lead. Historic data collection continues.
Site visits and walk-through audits are planned for these 14
buildings.
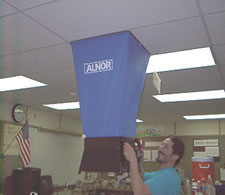
- Duct Testing Data from Manufactured Housing Factory
Visits
Over
the past 10 years, researchers at FSEC have worked with the
Manufactured Housing industry under the auspices of the U.S.
Department of Energy (DOE) funded Energy Efficient Industrialized
Housing Program and the Building America (BA) Program (www.buildingamerica.gov).
FSEC serves as the prime contractor for DOE’s fifth Building
America Team: the Building America Industrialized Housing Partnership
(BAIHP) which can be found online at: www.baihp.org.
Data
and findings presented here were gathered between 1996 and
2003 during 39 factory visits at 24 factories of six HUD
Code home manufacturers interested in improving the energy
efficiency their homes. Factory observations typically showed
that building a tighter duct system was the most cost effective
way to improve the product’s energy efficiency.
BAIHP and others recommend keeping duct system leakage to
the outside (CFM25 out) equal to or less than 3% of the conditioned
floor area, termed Qn out. However, most homes seen in a factory
setting cannot be sealed well enough to perform a CFM25 out
test. Results of many field tests suggest that CFM25 out will
be roughly 50% of total leakage (CFM25 total). Thus, to achieve
a Qnout of less than 3%, manufacturers should strive for a
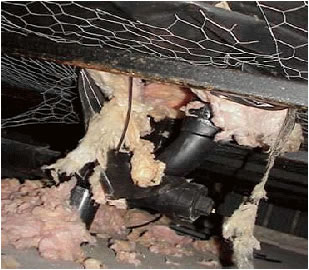
CFM25 total of less than 6% of the conditioned area (Qn total).
Researchers measured total duct leakage and/or duct leakage
to the outside in 101 houses representing 190 floors (single
wide equals one floor, double wide equals two floors, etc.).
Ducts systems observed in these tests were installed either
in the attic (ceiling systems) or in the belly (floor systems).
Researchers tested 132 floors with mastic sealed duct systems
and 58 floors with taped duct systems.
Of the 190 floors tested by BAIHP, the results break down
thus:
For mastic sealed systems (n=132):
- Average
Qn total = 5.1% (n=124); 85 systems (68%) achieved the
Qn total ≤ 6% target.
- Average
Qn out = 2.4% (n=86); 73 systems (85%) reached the Qn out ≤ 3%
goal.
For
taped systems (n=58):
- Average
Qn total = 8.2% (n=56); 19 systems (34%) reached the Qn
total ≤ 6% target.
- Average
Qn out = 5.7% (n=30), more than twice as leaky as the mastic
average; 5 systems (17%) reached the Qn out ≤ 3%
goal.
The
results show that, while it is possible to achieve the BAIHP
Qn goals by using tape to seal duct work, it is far easier
to meet the goal using mastic. What isn’t illustrated
by the results is the longevity of a mastic sealed system.
The adhesive in tape can’t stand up to the surface temperature
differences and changes or the material movement at the joints
and often fails. Mastic provides a much more durable seal.
Typical factory visits consist of meeting with key personnel
at the factory, factory observations, and air tightness testing
of duct systems and house shells. A comprehensive trip report
is generated reporting observations and test results, and pointing
out opportunities for improvement. This is shared with factory
personnel, both corporate and locally. Often, a factory is
revisited to verify results or assist in the implementation
of the recommendations.
The most commonly encountered challenges observed in the factories
include:
- Leaky supply and return plenums
- Misalignment of components.
- Free-hand cutting of holes in duct board and sheet metal.
- Insufficient connection area at joints.
- Mastic applied to dirty (sawdust) surfaces.
- Insufficient mastic coverage.
- Mastic applied to some joints and not others.
- Loose strapping on flex duct connections.
- Incomplete tabbing of fittings.
- Improperly applied tape
Duct system recommendations discussed in this report include:
- Set duct tightness target Qn equal to or less than 6% total
and 3% to outside.
- Achieve duct tightness by properly applying tapes and sealing
joints with mastic
- Accurately cut holes for duct connections
- Fully bend all tabs on collar and boot connections
- Trim and tighten zip ties with a strapping tool
- Provide return air pathways from bedrooms to main living
areas
Summary of BAIHP Approach to Achieving Tight Ducts in Manufactured
Housing:
- Set
goal with factory management of achieving Qnout<=3%
using Qntotal<=6% as a surrogate measurement while houses
are in production.
- Evaluate current practice by testing a random sample of
units
- Report Qntotal and Qnout findings; make recommendations
for reaching goals
- Assist with implementation and problem solving as needed
- Evaluate results and make further recommendations until
goal is met
- Assist with development of quality control procedures to
ensure continued success
Finally, duct tightness goals can be achieved with minimal
added cost. Reported costs range from $4 to $8. These costs
include in-plant quality control procedures critical to meeting
duct tightness goals.
Achieving duct tightness goals provides benefits to multiple
stakeholders. Improving duct tightness diminishes uncontrolled
air (and moisture) flow, including infiltration of outside
air, loss of conditioned air from supply ducts, and introduction
of outside air into the mechanical system. Uncontrolled air
flow is an invisible and damaging force that can affect the
durability of houses, efficiency and life of mechanical equipment,
and sometimes occupant health. With improved duct tightness,
manufacturers enjoy reduced service claims and higher customer
satisfaction, while homeowners pay lower utility bills, breathe
cleaner air, and have reduced home maintenance.
|


 You
are here:
You
are here: 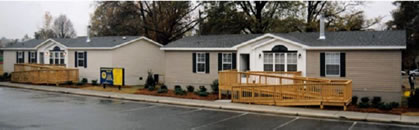