| |
|
| |
| Reference
Publication:
Chandra, Subrato, Neil Moyer, Danny Parker, David Beal,
David Chasar, Eric Martin, Janet McIlvaine, Ross McCluney,
Andrew Gordon, Mike Lubliner, Mike McSorley, Ken Fonorow,
Mike Mullens, Mark McGinley, Stephanie Hutchinson, David
Hoak, and Linda Tozer. Building America Industrialized
Housing Partnership, Annual Report - Fourth Budget Period.
04/01/03-03/31/04. |
|
|
| Building
America Industrialized Housing Partnership, Annual
Report - Fourth Budget Period |
|
|
Subrato
Chandra, Neil
Moyer, Danny
Parker, David
Beal, David
Chasar, Eric
Martin, Janet
McIlvaine, Ross
McCluney, Andrew
Gordon, Mike
Lubliner, Mike McSorley, Ken
Fonorow, Mike
Mullens, Mark
McGinley, Stephanie
Hutchinson, David
Hoak, and Linda Tozer |
|
| Florida
Solar Energy Center |
|
| |
|
|
A
weak link in the energy analysis of residential buildings
is heat transfer modeling for on-grade floors, crawlspaces,
and basements. Researchers planned to construct two test
buildings at FSEC to conduct this research. After careful
analysis, using a detailed finite element software to define
the size necessary for a residential test facility, staff
determined that the best facility size would be 40' x 40'.
However while gathering information about DOEs construction
processing paperwork, it was determined that the process would
probably take two years. Because of this information, the
task is being discontinued. This year, a request was made
to expend the funds for this task on an alternate high profile
task.
- NCA&TSU
Side-by-Side Manufactured Home Monitoring
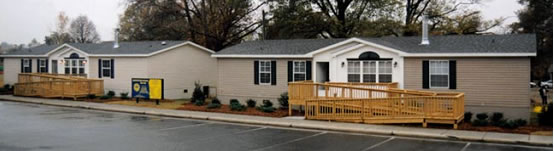
Side-by-side
monitoring of two manufactured homes at North Carolina Agricultural
and Technical State University (NCA&TSU), evaluated the
value of a variety of energy saving technologies and techniques.
(Please see Figure 62 and Table 21.) Home instrumentation
measured energy consumption as well as interior and exterior
climatic conditions. The "standard home," designed and built
to basic HUD code requirements, represented the control home.
Modified to use at least 50% less energy, the "energy home"
met Building America standards. Cooperating researchers at
NCA&TSU and FSEC investigated energy feature performance
and compared actual energy used to energy modeling program
predictions. In-situ energy performance data provided researchers
with interesting information on both issues.
 |
|
Figure 62. Side-by-side monitoring of manufactured
homes.
|
Each model contained 1,528 ft2
of living area with nearly identical floor plans. Though
the homes were unoccupied during the testing, home lighting
and water heating use was simulated with timers. A datalogger
in each home recorded: (1) the interior and exterior temperature
and humidity along with solar radiation and wind speed, (2)
the home's total power consumption, (3) the air conditioning/heat
pump compressor, air handler fan, and electric resistance
heater use (primary heater in the standard house, backup or
emergency heater for the energy house), and (4) water heating
and water usage data.
The energy house features combined higher
insulation values, improved windows, centralized and airtight
duct design, high efficiency heat pump, and a solar water
heater. Feature-by-feature construction differences are highlighted
in Table 21.
| Specifications
of Standard and Energy Construction |
| Characteristic |
Standard
House |
Building
America House |
| square
footage |
1528 |
1528 |
| floor
insulation |
R-11 |
R-22 |
| wall
insulation |
R-11 |
R-13 |
| ceiling
insulation |
R-20 |
R-33
+ roof deck radiant barrier |
| windows |
single
pane with interior storm |
low-E
thermopane (double) |
| exterior
doors |
storm
door on front |
storm
door on all |
| marriage
wall seal |
fiberglass
pad |
sof-seal
gasket |
| heating
system |
resistance
electric |
heat
pump HSPF 7.5 |
| cooling
system |
central
air conditioning SEER10 |
central
heat pump SEER12 |
| system
size |
3
tons |
2
tons |
| water
heating |
electric
water heater - 40 gallon |
solar
water heater - 66 gallon |
| duct
joints |
industry
standard |
sealed
with mastic |
| duct
leakage |
*CFM5out
= 145 |
CFM25out
= 83 |
| house
leakage |
**ACH50
= 10 |
ACH50
= 9 |
| Table
21. NCA&TSU side-by-side study of HUD Code homes |
*Cubic
feet per minute
**Air
changes per hour |
Data
collection on the two homes began in early January 2001 and
continued through this reporting period. Palm Harbor Homes
in Siler City manufactured both homes, the results for program
year three and four are detailed below.
Year
4 Side-by-Side Monitoring Results: During Phase 2, modifications
were made to the solar water heating system in the energy
efficient housing unit to help improve the performance this
system. Further, a number of the incandescent light bulbs
in the energy unit were replaced with compact fluorescent
bulbs. These changes were staged to allow an evaluation of
the effect of each measure on the home's energy use.
Based
on investigative results, it can be concluded that:
- Changes
in the building envelope, HVAC and duct systems, and fenestrations
in the energy home met researchers 50% energy use reduction
goal. Measured annual energy savings for heating and cooling
energy was 58%, and 53% for heating, cooling, and hot water
production.
- Care
should be exercised in the manufactured housing unit setup
or relatively minor construction deficiencies can significantly
reduce a home's energy efficiency. Many of these items
are invisible to the homeowner, therefore procedures must
be developed to ensure that deficiencies do not occur during
setup.
- The
Energy Gauge energy analysis program appears to give a reasonably
accurate prediction for expected energy use reduction in
a typical manufactured housing configuration. The predicted
energy savings for the housing units evaluated in this investigation
ranged from 54% to 63%, while the measured values ranged
from 53% to 58%. Version 2.0 of the Energy Gauge Program
provided a more accurate energy savings prediction than
the older software versions.
- An
increase in pipe and tank insulation can increase not only
the energy efficiency of a solar water heater by reducing
stand-by losses, but also can reduce the cooling load in
a manufactured housing unit and increase the overall energy
efficiency of the water heating unit. Even small amounts
of exposed piping can significantly affect the energy efficiency
of the water heating system.
- While
providing essentially the same lighting levels, replacing
incandescent lamps with compact fluorescent bulbs not only
reduces lighting energy use, but also reduces the home cooling
load.
The
total measured energy used by each of the housing units for
cooling and heating are shown in tables below. Table 22 shows
the energy used for heating and cooling the standard housing
unit from January through August of 2002. The standard home
datalogger was struck by lighting in mid-August 2002. Data
after this point was not included since only partial data
is available and performance comparisons were not possible.
Table 23 shows a summary of the cooling and heating energy
used by the energy housing unit. Tables 24 and 25 list the
energy use for hot water production for the standard and energy
units, respectively.
Cooling
and Heating Energy Use |
| |
SEP |
OCT |
NOV |
DEC |
JAN |
FEB |
MAR |
APR |
MAY |
JUN |
JUL |
AUG |
Actual
Values (kWh) |
| Phase
1 |
492.4 |
447.6 |
648.6 |
1741.1 |
2495.3 |
849.6 |
628.8 |
384 |
566.3 |
990.8 |
852.9 |
1066 |
| Phase
2 |
|
|
|
|
2120.2 |
1717.1 |
1227.6 |
502.0 |
438.0 |
939.4 |
1079.4 |
511.2 |
Table
22. Standard housing unit heating and cooling energy use.
Cooling
and Heating Energy Use |
| |
SEP |
OCT |
NOV |
DEC |
JAN |
FEB |
MAR |
APR |
MAY |
JUN |
JUL |
AUG |
|
Actual
Values (kWh) |
| Phase
1 |
337.3 |
205.7 |
150.8 |
452.8 |
1087.3 |
472.8 |
426.9 |
184.8 |
528.3 |
891.5 |
850.9 |
671.6 |
| Phase
2 |
|
|
|
|
680.7 |
537.1 |
378.1 |
241.9 |
311.8 |
603.0 |
668 |
626.6 |
Table
23. Energy housing unit heating and cooling energy use.
Domestic
Hot Water Use |
| |
SEP |
OCT |
NOV |
DEC |
JAN |
FEB |
MAR |
APR |
MAY |
JUN |
JUL |
AUG |
Actual
Values (kWh) |
| Phase
1 |
197.8 |
267.7 |
250.2 |
212.6 |
0 |
0 |
217.6 |
244.9 |
258.1 |
227.5 |
207.9 |
213.5 |
| Phase
2 |
|
|
|
|
294.6 |
280.9 |
283.2 |
264.9 |
280.2 |
192.2 |
200.3 |
85.2 |
Table
24. Standard housing unit energy use for domestic hot
water production.
Domestic
Hot Water Use |
| |
SEP |
OCT |
NOV |
DEC |
JAN |
FEB |
MAR |
APR |
MAY |
JUN |
JUL |
AUG |
Actual
Values (kWh) |
| Phase 1 |
133.4 |
176.2 |
204.2 |
189.9 |
0 |
0 |
245.5 |
184.4 |
183.0 |
141.2 |
152.3 |
126.6 |
| Phase 2 |
|
|
|
|
251.1 |
212.0 |
202.8 |
145.9 |
157.3 |
74.8 |
80.3 |
83.0 |
Table
25. Energy housing unit energy use for domestic hot water
production.
Also
listed in each table are the monthly energy use values measured
during the first phase of this investigation, January through
August 2001. Please note that the energy housing unit data
prior to August 2001 is suspect due to duct and HVAC system
problems later corrected. The entire data set, including,
temperature, relative humidity, solar radiation, and power
use is listed on the FSEC web site www.infomonitors.com.
The
total energy used for water heating and central cooling over
the period of August 1 through August 15 was 363.5 kWh for
the energy home and 596 kWh for the standard home. This represents
a 40 % reduction in energy use between the two homes.
The
total energy used over the period of August 1 through August
15 for water heating was 27.13 kWh for the energy house
and 85.18 kWh for the standard home. This represents a 68%
reduction in energy use with the solar water heating system
and compares well with the June and July reductions of 63%
and 60%, respectively. Consistent findings indicate that the
tank and piping insulation has reduced the standby tank losses
and improved the solar water system efficiency.
In
the energy housing unit, three of the 100 watt incandescent
lamps that were on the evening four-hour timed duration were
exchanged for 25 watt compact fluorescent lamps on June 4th.
This change did appear to have a small effect on the cooling
load in the energy housing unit. The relative cooling energy
used by each of the housing units from June, 2002 through
August 2002 showed a small change. The percentage reduction
in cooling energy used by the energy housing unit increased
from about 30% to 38%. However, it is difficult to isolate
the effects of the improvements in the solar water heating
system insulation and the effects of the compact fluorescent
bulbs. In any event, these effects appear to be much smaller
than that produced by the hot water system changes.
Year
3 Side-by-Side Monitoring Results: Heating system savings
(2001 to 2002) were a remarkable 70% during Phase 1. Cooling
energy season savings were 36%, less than heating but still
very substantial. The combined heating, cooling, and water
heating savings were 52% for a 9-month period. (Please see
Figure 63 for heating savings.)
 |
|
Figure
63. Average heating energy savings for NCA&TSU
energy home.
|
In addition to the energy monitoring effort, NCA&TSU researchers
investigated the feasibility of replacing the conventional framing/envelope
used in manufactured/industrial housing with alternative systems.
Included in this evaluation, was an analysis of the energy impact
of using aerated autoclaved concrete (AAC) flooring systems
and structural insulated panels (SIP) to supplant traditional
wall and roofing systems. The economic viability of using AAC
blocks for structural skirting/foundation around the model units
also was evaluated.
Analysis' results determined:
- The
best manufactured home energy performance can be achieved
using the SIP wall and roof systems with the AAC plank.
This performance can be further enhanced with an R-8 unvented
crawl space. Though a manufactured home performs best with
these alternative systems, the cost to include them may
not make economic sense.
- AAC
planks can be designed to replace both the steel frame and
flooring systems for HUD code manufactured housing units
and modular units. These planks also can be modified to
incorporate built-in insulated ducts.
- AAC
planks are pre-manufactured and require less assembly labor
than a typical stick framed unit, but including the plank
flooring would increase
framing costs by 28%. The heavier weight of an AAC system
might exacerbate high framing costs. Similarly, comparative
analysis results found that replacing a conventional framing
system with a SIP system would increase framing costs by
66%.
- At
the current prices for energy and wood products, neither
the AAC plank system nor the SIP systems are as economically
effective as improvements in the current conventional HVAC
systems, steel and wood framing, sheathing systems, and
air barriers with respect to improving energy performance.
- The
use of AAC planks has the potential to be economically viable
in the modular housing market, especially if used with sealed
crawl space foundation systems, where their improved resistance
to moisture degradation would be very important.
- SIP
wall and roof systems also could prove to be economically
viable if the price of wood energy increases, and the SIP
manufacturing costs decrease through large volume purchases.
- The
proposed AAC planking system presents a system that is significantly
less affected by water and moisture degradation and may
be effective in reducing manufactured housing units' susceptibility
to flood damage. These systems also are not susceptible
to termite attack.
- The
savings from reduced transportation damage from greater
durability and increased floor system stiffness were not
addressed in this investigation. It wouldn't take many
days of damage repair (at about $300/person-day for personnel
costs related to transportation) to vastly improve the economics
of these alternative systems.
|
Disclaimer:
This report was prepared as an account of work sponsored by an agency
of the United States government. Neither the United States government
nor any agency thereof, nor any of their employees, makes any
warranty, express or implied, or assumes any legal liability
or responsibility for the accuracy, completeness, or usefulness
of any information, apparatus, product, or process disclosed,
or represents that its use would not infringe privately owned
rights. Reference herein to any specific commercial product,
process, or service by trade name, trademark, manufacturer,
or otherwise does not necessarily constitute or imply its endorsement,
recommendation, or favoring by the United States government
or any agency thereof. The views and opinions of authors expressed
herein do not necessarily state or reflect those of the United
States government or any agency thereof.
|


