|
2.2
Field Monitoring
To
determine the impact of air handler location on heating and
cooling energy use, researchers measured the amount of air
leakage in air handler cabinets, and between the air handler
cabinet and the return and supply plenums. To assess this
leakage, testing was performed on 69 air conditioning systems.
Thirty systems were tested in the 2001 and 39 in 2002. The
69 systems were tested in 63 Florida houses (in six cases,
two air handlers were tested in a single house) located in
seven counties across the state - four in Leon County in or
near Tallahassee, 17 in Polk County, three in Lake County,
13 in Orange County, one in Osceola County, two in Sumter
County, and 29 in Brevard County. All except those in Leon
County are located in central Florida. Construction on all
houses was completed after January 1, 2001, and most homes
were tested within four months of occupancy.
In
each case, air leakage (Q25) at the air handler
and two adjacent connections was measured. Q25 is
the amount of air leakage which occurs when the ductwork or
air handler is placed under 25 Pa of pressure with respect
to its surrounding environment. Q25 also can be
considered a measurement of ductwork perforation.
To
obtain actual air leakage while the system operated, it was
necessary to measure the operating pressure differential between
the inside and outside of the air handler and adjacent connections.
In other words, it was necessary to know the perforation or
hole size and the pressure differential operating across that
hole. By determining both Q25 and operating pressure
differentials, actual air leakage into or out of the system
was calculated.
Field
Testing Leakage Parameters: Testing was performed on
69 air conditioning systems to determine the extent of air
leakage from air handlers and adjacent connections. Testing
and inspection was performed to obtain:
- Q25
in the air handler, Q25 at the connection to
the return plenum, and Q25 at the connection
to the supply plenum.
- Operating
pressure at four locations - the return plenum connection,
in the air handler before the coil, in the air handler after
the coil, and at the supply plenum connection.
- Return
and supply air flows were measured with a flow hood. Air
handler flow rates were measured with an air handler flow
plate device (per ASHRAE Standard 152P methodology).
- Overall
duct system and house airtightness in 20 of the 69 homes.
- Cooling
and heating system capacity based on air handler and outdoor
unit model numbers.
- The
location and type of filter.
- Dimensions
and surface area of the air handler cabinet.
- The
fractions of the air handler under negative pressure and
under positive pressure.
- The
types of sealants used at air handler connections.
-
Estimated portion of the air handler leak area that was
sealed "as found."
Air
Handler Leakage: Leakage in the air handler cabinet averaged
20.4 Q25 in 69 air conditioning systems. Leakage
at the return and supply plenum connections averaged 3.9 and
1.6 Q25, respectively. Using the operating pressures
in the air handler and at the plenum connections, these Q25
results convert to actual air leakage of 58.8 CFM on the return
side (negative pressure side) and 9.3 CFM on the supply side
(positive pressure side). The combined return and supply air
leakage in the air handler and adjacent connections represents
5.3% of the system air flow (4.6% on the return side and 0.7%
on the supply side). This is a concern, when considering that
a 4.6% return leak from a hot attic (peak conditions; 120oF
and 30% RH) can produce a 16% reduction in cooling output
and 20% increase in cooling energy use (Cummings and Tooley,
1989), and this was only from the air handler and adjacent
connections. (Please see Figure 56.)
"Total"
Duct Leakage: Some important observations were made from
the extended test data in 20 houses. Total leakage on the
return side of the system (including the air handler and return
connection) was 53 Q25r,total. With weighted operating
pressure on the return side of about -100 Pa (including the
air handler), operating return leakage was calculated to be
122 CFM, or 9.7% of the rated system air flow.
Total
leakage on the supply side of the system (Q25s,total)
was very large, at 134. The ASHRAE 152P method suggests using
half of the supply plenum pressure as an estimate of the overall
supply ductwork operating pressure, if the actual duct pressures
are not known. For the 20 systems with extended testing,
supply plenum pressure was 73.3 Pa. Based on a pressure of
37 Pa, actual leakage should be 167 CFM or about 13.3% of
the rated air flow. To test the ASHRAE divide by two method,
supply duct operating pressure measurements were taken from
14 representative systems. These averaged 35.9 Pa, compared
to 65.7 Pa for the supply plenums for those same 14 systems.
For these systems, the duct pressure was 55% of the supply
plenum pressure - making the ASHRAE method a reasonable method
for estimating central Florida home's supply ductwork
operating pressures.
However,
the ASHRAE method wasn't reasonable for estimating
central Florida home's return ductwork operating pressures.
For these 20 systems, 38% of the Q25r,total was
in the air handler and 62% of the Q25r,total was
in the return ductwork. Given an air handler pressure of
-133 Pa, a return plenum pressure of -81.5 Pa, and return
duct pressure of approximately -70 Pa, the weighted return
side pressure was approximately -95 Pa. By contrast, the
ASHRAE method predicted -41 Pa. Clearly, in systems with
a single, short return duct plenum like those commonly found
in Florida, the actual operating pressure should be greater
than the return plenum, maybe by as much as 1.2 times the
plenum pressure.
Return
side leakage is available on 58 of the 69 systems. Return
leak air flow (Qr,total) combined for the air handler,
return connection, and the return ductwork was found to be
152.4 CFM, or 11.8% of total rated system air flow for this
group. For this larger sample, Qr,total is considerably
greater than for the 20 houses with extended testing. These
alarming results show that even in these newly constructed
homes about 12% of return air and 13% of supply air duct systems
are leaking.
Duct
Leakage to "Out": In 20 homes, duct leakage to "out"
was measured. (Please see Table 15, below.) On average,
56% of the leakage of the return ductwork and supply ductwork
was to "out." "Out" is defined as outside the conditioned
space, including buffer spaces like an attic or garage. The
fraction of leakage that was to "out" varied by air handler
location. For return ductwork, the proportion of total
leakage to "out" is 81.4% for attic systems, 67.6% for garage,
and 28.0% for indoors. For supply ductwork, the proportion
of total leakage to "out" was in the range of 52% to 56% for
all three locations.
| Air
Handler Location |
Return |
Supply |
Entire
Duct System |
| Attic |
81.4% |
56.5% |
63.2% |
| Garage |
67.6% |
51.7% |
56.0% |
| Indoors |
28.0% |
52.6% |
37.1% |
Table
15. Portion of duct leakage to outdoors [(Q25,out/Q25,total)
* 100].
The
attic return ductwork was the most predictive variable to
"out" leakage findings. All of the return ductwork for attic
units was located in the attic. Much of the return ductwork
for other units was located in the house. As a consequence,
the energy penalty associated with locating the air handler
in the attic was greater than indicated in the computer modeling
results in Table 16, since the modeling only considered the
leakage of the air handler cabinet and the adjacent connections,
and not the return ductwork leakage.
| |
Attic
(CFM) |
Garage
(CFM) |
Indoors
(CFM) |
Combined
(CFM) |
| Air
Leakage |
Total |
Out |
Total |
Out |
Total |
Out |
Total |
Out |
| Q25,r
[58] |
61.9 |
50.4 |
93.3 |
63.1 |
67.8 |
19.0 |
75.7 |
44.9 |
| Q25,s
[20] |
109.1 |
61.6 |
170.6 |
88.2 |
119.5 |
62.9 |
134.3 |
71.4 |
| Qr
[58] |
118.1 |
96.1 |
194.4 |
131.4 |
134.6 |
37.7 |
152.4 |
90.4 |
| Qs
[20] |
135.6 |
76.6 |
212.0 |
109.6 |
148.5 |
78.1 |
166.9 |
88.7 |
Table 16. Duct
leakage "total" and to "out" for three locations, for both
25 Pa test pressure and for actual system operating pressure.
Sample size is in [brackets].
Table
16 (above) shows that the operating supply leakage to "out"
was large for all three air handler locations, averaging 89
CFM. The average operating return leakage to "out" was slightly
larger, at 90 CFM. However, there was a large variation between
air handler locations; 96 CFM for attic systems, 131 CFM for
garage systems, but only 38 CFM for indoor systems. From
an energy perspective, the attic systems experienced the greatest
"real" energy penalties, because all of the return ductwork
and air handlers were located in the attic. (Please see Table
15, p. 80.) By contrast, a majority of the return leakage
for the garage systems likely came from the garage (which
is considerably cooler than the attic). For indoor systems,
the return leakage to "out" most likely originated from the
attic. However, since the return leakage was so much smaller,
the energy impact was likely considerably less than both the
attic and the garage systems.
Correlation
of Supply Duct Leaks with Number of Registers: When analyzing
the supply leakage in the extended test data, a surprising
correlation was observed. This correlation indicated a systematic
and consistent duct fabrication problem across a wide range
of air conditioning contractors. Figure 57 illustrates this
correlation, showing that each supply duct has a remarkably
predictable total duct leakage. The coefficient of determination
is 0.86, indicating that 86% of the variability in total supply
duct leakage was explainable by the number of supply registers.
Figure 58 shows a similar relationship between supply leakage
to "out" and the number of supply registers. In this case
the coefficient of determination was 0.69, indicating that
69% of the variability in total supply duct leakage was explainable
by the number of supply registers. Note that one of the two
houses with 13 registers showed considerably less leakage
than expected. In this case, supply ducts were located in
the interstitial space between floors. When the house was
taken to -25 Pa, it is probable (though not measured) that
the interstitial spaces were substantially depressurized as
well, so leaks in those supply ducts would show less air flow
(i.e., less pressure differential = less leakage air flow)
and therefore be under-represented.
The
following two figures (Figures 57 and 58) suggest that a duct
leakage problem occurs in nearly all new homes. Researchers
identified three issues that create most of the leakage: (1)
the connection of the supply register or return grill, (2)
the boot (supply box) to sheet rock connection, and (3) the
flex duct to collar connection. The supply register or return
grill leakage typically shows as supply leakage in the "total"
test. It usually occurs when the register or grill does not
fit snugly to the ceiling or wallboard. Issues two and three
show up as leakage to both "out" and "total." (Please see
Figures 59 and 60.)
 |
 |
| Figure
57. Supply CFM25 "total" leakage versus the number
of supply registers. |
Figure 58. Supply CFM25 "out" leakage versus the
number of supply registers.
|
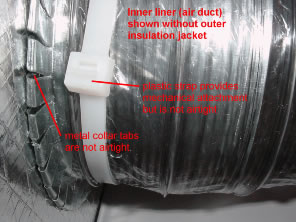
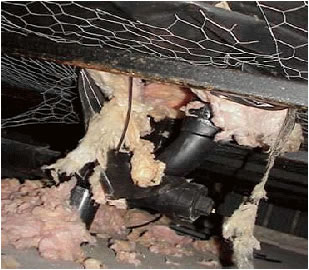
Figure 59 shows how flexible duct connections
typically are made. In some cases metal tape is used, but
the tape wrinkles when applied to complex angles and over
bumps associated with these connection types. Although small
in size, these cumulative wrinkles at each connection allow
air to pass through.
 |
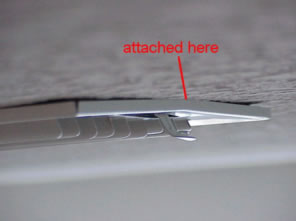 |
| Figure
59. Flexible duct to metal collar connection. |
Figure
60. Register to ceiling leakage. |
Computer
Modeling for Florida Energy Code Air Handler Multipliers:
FSEC researchers performed simulations and developed air
handler multipliers for the Florida Energy Code using this
study's simulation results. Researcher used the FSEC 3.0
model, a general building simulation program developed in
1992. This program provided simultaneous detailed simulations
of a whole building system, including energy, moisture, multi-zone
air flows, and air distribution systems.
In
2001, modeling had been performed to develop initial air handler
multipliers. These multipliers were based on estimated Q25
and duct operating pressures. At the time of the 2001 modeling,
there was essentially no data on air handler and connection
leakage. Modeling for this project was performed again, but
this time using the results of the 69 field tested homes.
The
modeling inputs used in 2001 and those from the current study
are shown below. (Please see Table 17.) Note that the same
Q25 and operating depressurization (dP) values
was used for all air handler locations, since there was essentially
no difference between the Q25 values for attic,
garage, and indoor air handler locations when gas furnace
units were removed from the analysis.
| |
2001
Q25 |
AH
Study Q25 |
2001
dP |
AH
Study dP |
| Return
connection |
8.7 |
3.9 |
-40 |
-86.1 |
| AH
- depressurized portion |
48.5 |
17.6 |
-42 |
-139.1 |
| AH
- pressurized portion |
9.6 |
2.8 |
43 |
106.5 |
| Supply
connection |
7.8 |
1.6 |
32 |
58.2 |
| Total |
74.6 |
25.9 |
|
|
Table
17. Air handler (AH) and connection inputs for 2001 and
current project computer modeling.
While
the Q25 leakage for the air handler and connections
was about 65% less than earlier estimates, operating pressures
were much higher. The air handler multipliers based on the
current computer modeling results are presented in Tables
18, 19, and 20. Modeling of air handler energy use also was
performed for the air handlers located outdoors, despite the
fact that no field data was collected for outdoor units.
The modeling input parameters were the same as the other air
handler locations as shown in Table 17. Note also that the
air handler multipliers for the attic, indoors, and outdoors
are normalized to the garage, since this location was considered
the baseline.
| AH Location |
Winter |
Summer |
| old |
2001 |
new |
old |
2001 |
new |
| attic |
1.04 |
1.15 |
1.12 |
1.04 |
1.09 |
1.06 |
| garage |
1.00 |
1.00 |
1.00 |
1.00 |
1.00 |
1.00 |
| indoors |
0.93 |
0.91 |
0.94 |
0.93 |
0.91 |
0.92 |
| outdoors |
1.03 |
1.08 |
1.06 |
1.03 |
1.03 |
1.01 |
Table
18. Florida Energy Code AH Multipliers for South Florida.
| AH Location |
Winter |
Summer |
| old |
2001 |
new |
old |
2001 |
new |
| attic |
1.04 |
1.11 |
1.08 |
1.04 |
1.10 |
1.08 |
| garage |
1.00 |
1.00 |
1.00 |
1.00 |
1.00 |
1.00 |
| indoors |
0.93 |
0.92 |
0.94 |
0.93 |
0.90 |
0.92 |
| outdoors |
1.03 |
1.09 |
1.05 |
1.03 |
1.02 |
1.01 |
Table
19. Florida Energy Code AH Multipliers for Central Florida.
| AH Location |
Winter |
Summer |
| old |
2001 |
new |
old |
2001 |
new |
| attic |
1.04 |
1.10 |
1.03 |
1.04 |
1.11 |
1.08 |
| garage |
1.00 |
1.00 |
1.00 |
1.00 |
1.00 |
1.00 |
| indoors |
0.93 |
0.93 |
0.94 |
0.93 |
0.91 |
0.92 |
| outdoors |
1.03 |
1.07 |
1.02 |
1.03 |
1.02 |
1.01 |
Table
20. Florida Energy Code AH Multipliers for North Florida.
The
final report for this study can be viewed online athttp://www.fsec.ucf.edu/bldg/pubs/cr1357/index.htm.
|


