| |
|
| |
| Reference
Publication:
Chandra, Subrato, Neil Moyer, Danny Parker, David Beal,
David Chasar, Eric Martin, Janet McIlvaine, Ross McCluney,
Andrew Gordon, Mike Lubliner, Mike McSorley, Ken Fonorow,
Mike Mullens, Mark McGinley, Stephanie Hutchinson, David
Hoak, and Linda Tozer. Building America Industrialized
Housing Partnership, Annual Report - Fourth Budget Period.
04/01/03-03/31/04. |
|
|
| Building
America Industrialized Housing Partnership, Annual
Report - Fourth Budget Period |
|
|
Subrato
Chandra, Neil
Moyer, Danny
Parker, David
Beal, David
Chasar, Eric
Martin, Janet
McIlvaine, Ross
McCluney, Andrew
Gordon, Mike
Lubliner, Mike McSorley, Ken
Fonorow, Mike
Mullens, Mark
McGinley, Stephanie
Hutchinson, David
Hoak, and Linda Tozer |
|
| Florida
Solar Energy Center |
|
| |
|
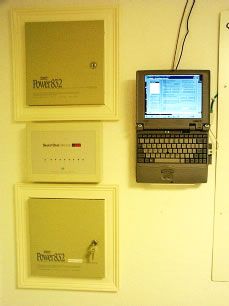 |
| Figure 43. New datalogger monitoring computer system
with remote monitoring and control capacity |
House
Monitoring:
$ Monitor Overview: Monitors
on the Hoak residence include 11 attic temperature and relative
humidity sensors, three indoor sensors, a Hobo event logger
to record the dehumidifier cycling time, and a tipping bucket
rain gauge with Hobo logger to monitor the combined condensate
of the air conditioner, dehumidifier, and heat pump water
heater . In 2002, Alten Design also assembled a new logger
monitoring computer with the capability of reading data from
two Campbell 21X loggers. This computer was configured with
remote monitoring and control capacity so that team members
can program and maintain the system without traveling to the
site. (Please see Figure 43).
$ Attic Sensors: There
are nine Hobo temperature/relative humidity sensors located
in the unvented attic spaces. The living space and unvented
attic are split in the house, with the unvented space divided
into front and rear attics by a cathedral ceiling. Two of
the Hobo sensors are located in the front unvented attic.
The air conditioning ductwork and zone dampers also are located
in this attic space. They are located on the far left and
right of the front mid-body section. (Please see Figure 44,
below.)
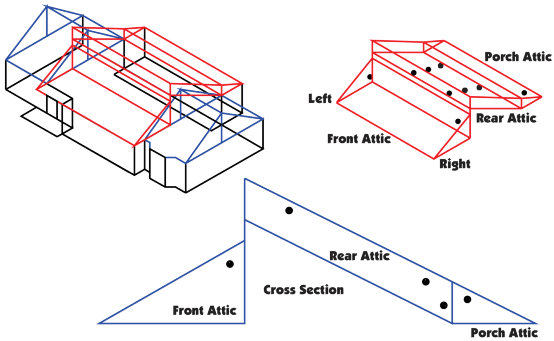 |
Figure 44. Drawing shows
placement of Hobo temperature/relative humidity sensors
at the Hoak residence attic |
 |
| Figure 45. Three indoor
sensors monitor daily temperature humidity swings in the
residence. |
There are six Hobo sensors in the rear unvented attic. This
space is about twice the square footage of the front attic
and because of its orientation receives a larger amount of
solar radiation in a day. Because there is a large elevation
difference between the bottom and top of this attic, sensors
were located at the bottom, middle, top, and on each end of
the attic. Behind the rear unvented attic is another unvented
attic which covers the back porch. This space is separated
from the rear attic by an Icynene insulated kneewall. The
porch attic is uninsulated and has no flow ventilation between
it and the outside. This attic contains one Hobo temperature/relative
humidity sensor.
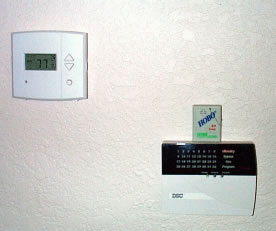
$ Indoor Sensors: There are three Hobo temperature/relative
humidity sensors located inside the home, one on each of the
three floors. These are used to monitor the normal day-to-day
temperature swings in the living space. (Please see Figure
45, above.)
$ Moisture Removal Sensors: There is one Hobo
sensor that monitors indoor moisture removal. It monitors
the periodic cycle time of the dehumidifier as well as the
moisture removed by the air conditioning system and heat pump
water heater.
$ Moisture Levels: FSEC and Alten Design installed
new moisture detection sensors in the Hoak house unvented
attic. The purpose of these sensors is to determine moisture
level in the wood members of the attic. Previously, only ambient
attic moisture levels were logged.
In this reporting period, Alten Design installed an additional
sensor to detect duration and time of supplemental dehumidification.
Another sensor collects condensation data from the home's
air conditioning system, dehumidification system, and heat
pump water heater. Data from both new sensors are being included
with other weekly data uploads to provide a complete picture
of temperature and humidity changes throughout the day.
Preliminary
Findings
$ Duct Leakage:
Duct leakage test results showed the Hoak home air loss was
only 50 CFM at 25 Pa or 1.2% leakage per square foot of conditioned
floor area - far below the amount of leakage normally found
in new Florida homes.
Total duct leakage is less than 10% of air handler flow (200
CFM). Blower door performance tests verified the home's level
of airtightness at two air changes per hour at 50 Pa (ACH50
= 2.0). When including leakage around the supply grills,
house leakage increased about 30%. Slightly more than half
of the house leakage (1479 CFM at 50 Pa) is located in the
sealed attic space (760 CFM at 50 Pa).
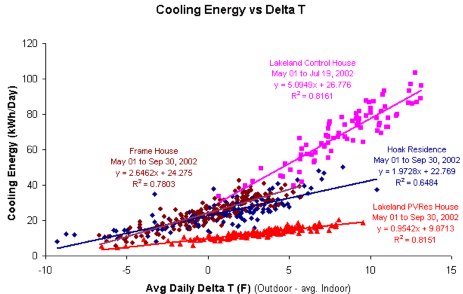 |
Figure 46. Cooling energy
use comparison Hoak home, PV Res home, Lakeland control
home, and central Florida frame home. |
$ Cooling Energy: Initial
data comparisons were made against data collected from a Lakeland,
Florida residence (PVRes), designed by FSEC and monitored
for more than a year. The PVRes home contained the most energy-efficient
provisions researchers could devise, including a 5 kW photovoltaic
system. (Please See Table 12.)
| Home |
HERS
Score |
Home
Location |
| Hoak Home |
92.2 |
Longwood |
| PVRes Home |
94.4 |
Lakeland |
Table 12. HERS scores generated with Energy Gauge.
Data collected at the Hoak home shows the cooling energy is
nearly on par with the PVRes Home on a per square foot basis.
(Please see Figures 46 and 47 below.)
$ Envelope: Weekly data logs of the Hoak home
provided by Alten Design from the 14 Hobo temperature and
relative humidity sensors and pressure tests through March
2003, confirm that air pathways between the unvented attic
and outdoors still exist. Researchers suspect that these
pathways may be the primary source of moisture intrusion into
the unvented attic space. Several whole house pressure tests
(smoke tests) were performed by Alten Design and FSEC to isolate
these external sources of air infiltration. Identified leaks
were sealed, though actions have shown some benefit moisture
levels are still higher than desired.
In order to isolate areas of leakage, barriers will be placed
in the house splitting the areas under test into easier to
monitor individual zones.
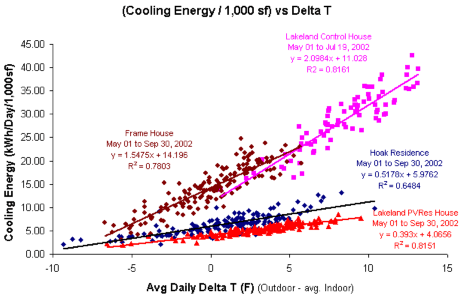 |
Figure 47. Cooling energy
use comparison per thousand square feet of Hoak residence, PV Res home, Lakeland control home,
and central Florida frame home.
|
|
Disclaimer:
This report was prepared as an account of work sponsored by an agency
of the United States government. Neither the United States government
nor any agency thereof, nor any of their employees, makes any
warranty, express or implied, or assumes any legal liability
or responsibility for the accuracy, completeness, or usefulness
of any information, apparatus, product, or process disclosed,
or represents that its use would not infringe privately owned
rights. Reference herein to any specific commercial product,
process, or service by trade name, trademark, manufacturer,
or otherwise does not necessarily constitute or imply its endorsement,
recommendation, or favoring by the United States government
or any agency thereof. The views and opinions of authors expressed
herein do not necessarily state or reflect those of the United
States government or any agency thereof.
|


