


III. BAIHP Research A
BAIHP has found that using the systems engineering approach to help Industry Partners solve building science related problems develops a strong working relationship and increases the likelihood of the Partner incorporating concepts central to achieving Building America goals such as sealed and tested ducts, right sizing air conditioning, and moisture management. BAIHP’s work with the manufactured housing industry illustrates this principal.
BAIHP conducted research for manufactured homes in both field and laboratory which is reported in the following summaries:
-
Air conditioner thermostat settings (typically 68 º to73 º F) set below the ambient dew point.
-
Negative pressures across the envelope from high supply duct leakage (CFM @25Pa >10 per 100 square feet of conditioned floor area), inadequate return air paths, interior door closures, exhaust fans, or a combination thereof.
-
Inadequate moisture removal from disconnected return ducts, continuous fan operation (air handler or ventilation), inadequate condensate drainage, oversized air conditioners, or a combination thereof.
-
Moisture diffusion from the ground into the house because of poor site drainage, inadequate crawl space ventilation, tears in the belly board, or a combination thereof.
-
Vapor-retardant in the wrong location (i.e., vinyl or other impermeable wall or floor coverings located on the colder surfaces).
-
Maintain air conditioning thermostat settings above the ambient dew point (at least 75º F).
-
Eliminate long-term negative pressures created by air handler fans or ventilation equipment.
-
Tightly seal all ductwork and provide adequate return air pathways.
-
Enhance moisture removal from the conditioned space by correct equipment sizing and maintenance.
-
Eliminate ground source water and provide an adequate moisture barrier for the floor assembly.
-
If possible, remove vapor barriers located on the wrong surfaces.
-
Average house size is 1769 ft2; double section homes are also getting bigger, on average. The house size is very comparable to the homes built in 1997-1998 but 20% larger than the homes in 1994-1995 study
-
Houses are getting tighter, according to the blower door results. The average air leakage rate at 50 Pa is 4.2, which represents a tightening of almost 25% over the original MAP home average. The median equivalent leakage area (ELA) for double-section homes has decreased by about 12% despite a substantial increase in house size.
-
Only about 20% of NEEM homes in this study contain intentional outside air inlets. This is the result of BAIHP research indicating that intentional outside air inlets are unnecessary to provide adequate fresh air.
-
2/3 of homes in the study have dedicated whole house fans and a substantial fraction of homeowners are using their whole house fans. However, a significant minority (30%) does not turn them on.
-
About half of homes in the study use central cooling, with more than half of these homes using a heat pump.
-
Duct systems are about 20% leakier than in the Year 1 study and about 10% leakier than in the 1994-1995 study (when the comparison is normalized by house size).
-
The median supply leakage fraction is 11-13% for the homes in this sample. The duct loss translates into a heating system efficiency loss of between 10-20% overall, depending on the location of the home (west side or east side of the mountains) and type of heating equipment (heat pumps perform worse).
-
Total electric use from grid
-
Resistance elements in heat pump
-
Heat pump compressor and fan motors
-
Water heating equipment, including gallons used
-
PV energy production (ZEMH)
-
Case 4, the dehumidifier system, has the highest average power at 1592 watts.
-
Case 7 (humidistat controlled fan speed or Hstat) is second highest at 1485 watts.
-
Case 5 (10/20 cycle controller) used the least power at 1315 watts.
-
Changes in the building envelope, HVAC and duct systems, and fenestrations in the energy home met researchers’ 50% energy use reduction goal. Measured annual energy savings for heating and cooling energy was 58%, and 53% for heating, cooling, and hot water production.
-
Care should be exercised in the manufactured housing unit setup or relatively minor construction deficiencies can significantly reduce a home’s energy efficiency. Many of these items are invisible to the homeowner; therefore procedures must be developed to ensure that deficiencies do not occur during setup.
-
The Energy Gauge energy analysis program appears to give a reasonably accurate prediction for expected energy use reduction in a typical manufactured housing configuration. The predicted energy savings for the housing units evaluated in this investigation ranged from 54% to 63%, while the measured values ranged from 53% to 58%. Version 2.0 of the Energy Gauge Program provided a more accurate energy savings prediction than the older software versions.
-
An increase in pipe and tank insulation can increase not only the energy efficiency of a solar water heater by reducing stand-by losses, but also can reduce the cooling load in a manufactured housing unit and increase the overall energy efficiency of the water heating unit. Even small amounts of exposed piping can significantly affect the energy efficiency of the water heating system.
-
While providing essentially the same lighting levels, replacing incandescent lamps with compact fluorescent bulbs not only reduces lighting energy use, but also reduces the home cooling load.
-
The best manufactured home energy performance can be achieved using the SIP wall and roof systems with the AAC plank. This performance can be further enhanced with an R-8 unvented crawl space. Though a manufactured home performs best with these alternative systems, the cost to include them may not make economic sense.
-
AAC planks can be designed to replace both the steel frame and flooring systems for HUD code manufactured housing units and modular units. These planks also can be modified to incorporate built-in insulated ducts.
-
AAC planks are pre-manufactured and require less assembly labor than a typical stick framed unit, but including the plank flooring would increase framing costs by 28%. The heavier weight of an AAC system might exacerbate high framing costs. Similarly, comparative analysis results found that replacing a conventional framing system with a SIP system would increase framing costs by 66%.
-
At the 2001-02 prices for energy and wood products, neither the AAC plank system nor the SIP systems are as economically effective as improvements in the current conventional HVAC systems, steel and wood framing, sheathing systems, and air barriers with respect to improving energy performance.
-
The use of AAC planks has the potential to be economically viable in the modular housing market, especially if used with sealed crawl space foundation systems, where their improved resistance to moisture degradation would be very important.
-
SIP wall and roof systems also could prove to be economically viable if the price of wood energy increases, and the SIP manufacturing costs decrease through large volume purchases.
-
The proposed AAC planking system presents a system that is significantly less affected by water and moisture degradation and may be effective in reducing manufactured housing units’ susceptibility to flood damage. These systems also are not susceptible to termite attack.
-
The savings from reduced transportation damage from greater durability and increased floor system stiffness were not addressed in this investigation. It wouldn’t take many days of damage repair (at about $300/person-day for personnel costs related to transportation) to vastly improve the economics of these alternative systems.
-
Portable classrooms in the Pacific Northwest are occupied about 1225 hours per year, or about 14% of the total hours in a year.
-
The average number of occupants in the standard 28’ x 32’ portable classroom provide an internal heat of about 480 kWh/year, or 8% to10% of space heating requirements.
-
Most of the heat loss in portable classrooms manufactured after 1990 occurs by air leaking through the T-Bar dropped ceilings, because they have no sealed air/vapor barrier. This newly created phenomenon occurred with the incorporation of the less expensive dropped T-Bar ceiling in place of the more expensive sheet rock used in older portables. Air leakage also is increased because of unsealed marriage lines - now used as a low cost method of meeting the state attic ventilation requirements.
-
Since all portables tested in the project used a simple seven-day programmable thermostat, the HVAC systems operate during vacations and holidays.
-
Energy codes in Washington, Oregon, and Idaho are high enough to make beyond-code envelope measures non cost-effective.
-
Older portable classrooms under removal consideration could be retrofitted with new energy efficiency measures at much less cost than purchasing a new portable classroom. Installing low-E, vinyl framed windows, insulated doors, T-8 light fixtures, and caulking and sealing air leaks can all be cost-effective when refurbishing older portable classrooms. HVAC system replacement in older portable classrooms will be the biggest single cost item, ranging from $4500 to $6500.
-
CO2 sensors appear to be unreliable as a control strategy. Those installed by field crews and monitored by dataloggers in this study did not match the readings shown by the CO2 sensors which controlled the ventilation systems.
-
Install 365 day programmable thermostats in all existing portables and specify these thermostats for new construction.
-
In portable classrooms constructed with T-Bar dropped ceilings, install an air/vapor barrier above the T-Bar system on the warm side of the insulation. Completely seal all edges and overlaps.
-
If roof rafter insulation is used, seal the marriage line at the roof rafter joint with approved sealant such as silicon caulk or foam. Make sure there is adequate ventilation between the insulation and the roof.
-
Conduct an audit of older portables scheduled for disposal to determine if retrofitting would be more cost effective than purchasing a new unit.
-
Install occupancy sensors to control the ventilation system.
-
Specify that new portables contain windows on opposing walls.
-
Specify that new portable units contain exhaust fans on the opposite side of the classroom from the fresh air supply.
-
Incorrect wiring of the exhaust fan, causing it to run continually. The fan was rewired in 2000 during the summer break. Once corrected, energy use in the portable declined.
-
Incorrect programmable thermostat settings which were not programmed to turn the heating and cooling system off during holidays and vacations. Though energy use was reduced when the portable was unoccupied, use was still excessive (Figure 78).
-
Higher air leakage in the energy efficient portable than the control portable. Blower door testing found 19 ACH at 50 Pa in the energy efficient classroom compared to nine ACH at 50 Pa in the control classroom. Follow-up blower door, smoke stick, and APT pressure tests indicated that the predominant leakage path tracked through the T-bar ceiling and into the vented attic due to an ineffective air barrier in the energy efficient portable. The control portable contains taped ceiling drywall.
-
No initial HVAC commissioning by the HVAC supplier or the school district.
-
Significant HVAC system alterations (including rewiring, ventilation system VOC sensor replacement with a CO2 sensor, and modifications to other aspects of the HVAC control system) during 2001 by maintenance staff and the HVAC supplier, unbeknownst to BAIHP staff. Calibration testing done by scientists at the Florida Solar Energy Center on the CO2 sensors showed significant drift in output results. This made data collected virtually unusable.
-
The use of plug-in electric heaters during the winter of 2001 by the resident teacher because of room comfort problems. This led to significant room temperature variations and monitoring data showed high plug-load energy use.
-
Poor fresh air flow design with the fresh air intake and exhaust fan positioned so they create a “short circuit” of fresh air, bypassing the students and teacher.
-
Well-defined commissioning protocols, documentation, and coordination among all personnel that service and install the HVAC equipment. This is a critical component of efficient and healthy classroom operation and should include outside airflow rate measurements to assess adequate ventilation and control testing to insure correct system operation.
-
Design changes to the portable classroom manufacturer, including the use of a structural insulated panel system (SIPS), tighter ceiling barrier and sheetrock ceilings, elimination of the vented attic, and relocation of the exhaust fan to the wall opposite the supply air vent.
-
Removal of current HVAC controls and replacement with both an occupancy sensor-driven control for the ventilation system and a heating system programmable thermostat. Staff also proposed a classroom on/off switch to simplify the system turnoff during unoccupied summer and school vacations.
-
Location of exhaust fans in future portables on the wall opposite the supply air vent.
-
Window installation on opposing sides of the classroom to increase daylight penetration and to assist in passive cross-ventilation.
-
Average Qntotal = 5.1% (n=124); 85 systems (68%) achieved the Qntotal ≤ 6% target.
-
Average Qnout = 2.4% (n=86); 73 systems (85%) reached the Qnout ≤ 3% goal.
-
Average Qntotal = 8.2% (n=56); 19 systems (34%) reached the Qntotal ≤ 6% target.
-
Average Qnout = 5.7% (n=30), more than twice as leaky as the mastic average; 5 systems (17%) reached the Qnout ≤ 3% goal.
-
Leaky supply and return plenums
-
Misalignment of components.
-
Free-hand cutting of holes in duct board and sheet metal.
-
Insufficient connection area at joints.
-
Mastic applied to dirty (sawdust) surfaces.
-
Insufficient mastic coverage.
-
Mastic applied to some joints and not others.
-
Loose strapping on flex duct connections.
-
Incomplete tabbing of fittings.
-
Improperly applied tape
-
Set duct tightness target Qn equal to or less than 6% total and 3% to outside.
-
Achieve duct tightness by properly applying tapes and sealing joints with mastic
-
Accurately cut holes for duct connections
-
Fully bend all tabs on collar and boot connections
-
Trim and tighten zip ties with a strapping tool
-
Provide return air pathways from bedrooms to main living areas
-
Set goal with factory management of achieving Qnout<=3% using Qntotal<=6% as a surrogate measurement while houses are in production.
-
Evaluate current practice by testing a random sample of units
-
Report Qntotal and Qnout findings; make recommendations for reaching goals
-
Assist with implementation and problem solving as needed
-
Evaluate results and make further recommendations until goal is met
-
Assist with development of quality control procedures to ensure continued success
-
Building Science and Moisture Problems in Manufactured Housing
-
BAIHP Field Visits to Moisture Problem Homes
-
Manufacturers Participating in Building Science Research
-
Duct Testing Data from Manufactured Housing Factory Visits
-
Dehumidifier set at 40% relative humidity
-
Dehumidifier set at 50% relative humidity
-
Forced ventilation rates using house air – ASHRAE 62.2.
-
Forced ventilation rates using house air – 50 CFM
-
Forced ventilation rates using house air – 20CFM/1000ft2
Papers: Subrato Chandra, Danny Parker, David Beal, David Chasar, Eric Martin, Janet McIlvaine, Neil Moyer. Alleviating Moisture Problems in Hot, Humid Climate Housing. Position Paper for NSF Housing Research Agenda Workshop, UCF Feb. 12-14, 2004.
Moyer,
N., Beal, D., Chasar, D., McIlvaine, J., Withers, C, & Chandra,
S. (2001). “Moisture Problems in
Manufactured Housing: Probable Causes and Cures.” ASHRAE -
IAQ 2001 Conference
Proceedings,
San Francisco, CA.
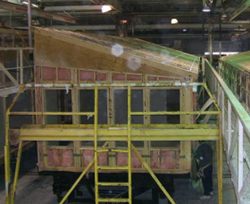 |
Figure 58. Palm
Harbor HUD Code Manufactured Housing factory – production
line. |
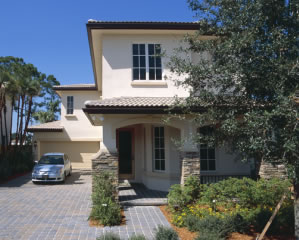
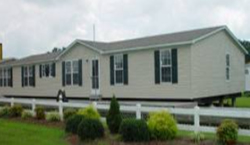 |
Figure 59. Completed HUD
Code Manufactured Home,
Palm Harbor Homes |
Manufactured homes have a permanent steel chassis attached below the floor and are constructed in a factory (Figure 58) to meet a national code maintained by the U.S. Department of Housing and Urban Development (HUD). After production, homes may travel a few hundred miles, hauled by truck, before final setup. The homes are setup by placing blocks under the steel I-beams and anchoring the beams firmly to the ground. A skirting covers the blocks and steel frame in a fully setup home (Figure 59).
Manufactured homes are typically heated or cooled by a system of ductwork, which delivers hot or cold air from the air handler unit (AHU). The ductwork can be in the attic or in the belly cavity of the home. The ducts are typically made of aluminum or fiberglass trunk lines which supply air to the floor registers through in-line boots or flex ducts. The boots or ducts terminate at perimeter registers on the floor. Supply duct leaks represent one of the biggest causes of moisture problems in manufactured homes. (Figures 60 and 61). Poor design and construction leave holes at the AHU connection to the main trunk, and where the boots connect to the trunk, supply registers, end caps, cross-over duct connections, and other connection points. When the AHU blows air, some air leaks into the belly and eventually to the outside through belly board tears. This loss of air creates a negative pressure inside the house and a positive pressure in the belly. The negative pressure pulls outside or attic air into the house through cracks and crevices which connect the inside of the house to the outside or to the attic. During northern winters, this outside air is cold and dry and its entry increases occupant discomfort and heating energy use.
During summer in the Southeastern US, the air is consistently at or above the dewpoint of 75 º. If a homeowner keeps their home thermostat set below this 75 º F dewpoint, the moisture laden outside air condenses as it comes into contact with the cold inside surfaces. If it condenses behind an impermeable surface such as vinyl flooring or wallpaper, serious mold, mildew, and floor buckling problems can result.
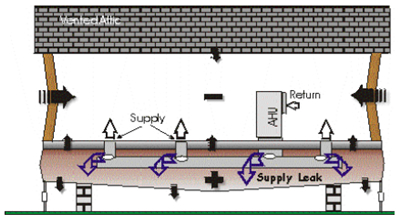
Figure 60. Pressure field and unintentional air flow created by supply duct leaks.
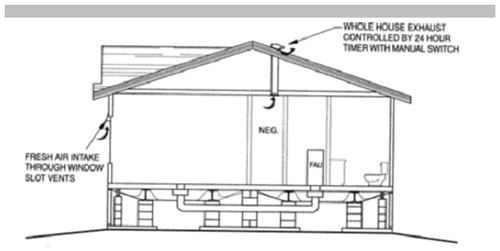
Figure 61. Cross section
showing foundation support, crossover
duct, and one type of ventilation
system in a manufactured home.
Many manufactured and site-built homes have only a single return and,
therefore, very little return air transfer from the bedrooms (basically
via the undercut at the bottom of interior doors). When interior doors
are closed, rooms off the main body (e.g., bedrooms) become pressurized
and the main body of the house depressurizes. Even though negative
pressures are usually only one to three pascals (Pa) - they can cause
serious problems in a home.
Researchers use a calibrated fan called a ductblaster to measure duct leakage. The ductblaster is attached to the return grill or the crossover duct opening (Figure 62) and all supply registers are masked off and the fan is turned on. Once the house ductwork reaches –25 Pa, airflow through the fan is read (in CFM). The resultant measure is the total duct leakage. In good airtight ductwork, total duct leakage (CFM@25 Pa) should be less than 6% of the homes square footage.
A second duct leakage test measures leakage to the outside. This leakage is calculated by depressurizing the entire house to –25 Pa with a blower door, then adjusting the ductblaster flow so there is no pressure difference between the house and the ducts. This measurement is a true indicator of duct air loss to the outside and is used in energy calculations for estimating the
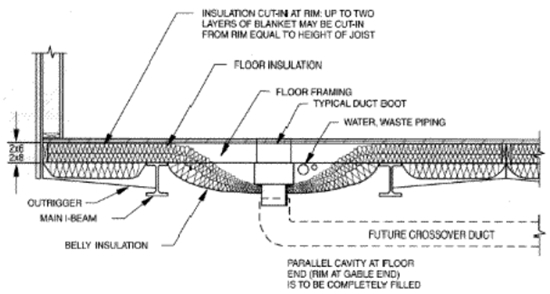
Figure 62. Floor and belly area with supply ducts. These ducts supply conditioned air to all rooms through floor vents, a common duct system layout in manufactured homes.

The battery of tests run in a problem house typically includes measuring
the air tightness of the house with a blower door, depressurizing the
house to –50 Pa. At that time, the house to belly and belly to
crawlspace pressures also can be measured. Researchers also test pressure
differentials caused by AHU operation and closed interior doors. An
additional measurement of duct leakage, called pressure pan, is conducted
on some houses to pinpoint specific registers which might have large
leaks. In this measurement the house is first depressurized to –50
Pa and all the register vents are unmasked. Then the registers are
covered one by one and the pressure difference between the covered
register and the house is measured. A zero reading indicates no leakage
at that register. Readings over one Pa indicate a sizeable leak that
should be repaired.
A significant number of new manufactured houses built to HUD code and located in the hot, humid Southeast have exhibited moisture problems. Soft wallboards, buckled floors, damaged wood molding, and extensive mold growth are the most common symptoms. These problems do not respond to the standard service and repair strategies for water intrusion.
Summary of 1st-4th Budget Period Field Visits to Moisture Problem Homes
At the request of six manufacturers, 69 such moisture damaged homes were investigated from 1999 to the end of reporting year four (through March 31, 2003) to determine likely causes. In Year 4 alone, 18 homes were investigated by FSEC. One-time blower door, duct tightness, and pressure differential measurements were performed on all homes. Field data on ambient, crawlspace, belly and house temperatures, plus relative humidity levels were collected on a few of the homes. Recommendations and reports were prepared for the manufacturers’ service, production, and design staff. Field repairs were performed in most of these homes. A general theme was found in the houses investigated.
Recommended solutions provided to the manufacturers to eliminate moisture problems included:
Research continues to determine if these steps will be sufficient to prevent problems even when vapor barriers are incorrectly located in homes in the hot, humid climate. Preliminary results are encouraging. One manufacturer has not reported a single new moisture problem in any of the homes produced since 2000 in a factory that previously had a significant number of problem homes. Steps taken by the factory were inclusion of airtight duct systems (a zero net-cost increase), right-sized cooling systems (a negative cost), return air ducts from all bedrooms (a cost of about $15), installation of a ground vapor barrier (no change from previous practice).
Summary of 5th Budget Period Field Visits to Moisture Problem Homes
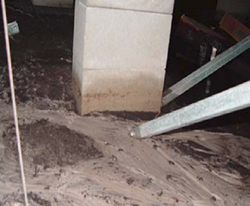 |
Figure 63. Flow lines under
house, indicating running water under the house. Also note the “tide
line” on the support column. |
BAIHP researchers at FSEC received fewer requests in the 5th budget period for assistance with moisture damaged homes (Table 44), reflecting improvement of duct construction and sealing, addition of return air pathways from bedrooms, and reduction of vapor impermeable interior surfaces. Additionally, service personnel who have attended BAIHP training and participated in field work with BAIHP are more prepared to resolve problems without assistance. Service personnel report installing passive return air vents in bedrooms, providing appropriate moisture barriers, and sealing duct leaks to resolve humidity, comfort, and moisture damage call backs.
When service personnel have been unable to resolve a problem, they request assistance from BAIHP researchers who attend a service call and conduct various diagnostic tests to identify factors contributing to the moisture, comfort, or high energy bill problem. (MHRA has been providing similar services on a fee basis to the industry also.) After BAIHP researchers complete a field visit, a trip report is issued detailing the findings and recommendations, include basic building science background material.
Table 44. 5th Budget Period – FSEC
Field Visits
to Problem Manufactured Homes
| Manufacturer | Location | Date |
| Fleetwood Homes | Florida (2 homes) | August 03 |
| Florida (2) | November 03 | |
| Texas (1) | December 03 | |
| West Virginia (1) | March04 | |
| Cavalier Homes | Florida (1) | November 03 |
| Southern Energy Homes | Kentucky(1) | December 03 |
| Texas (1) | January 04 | |
| Style Crest | Louisiana (1) | February 03 |
| 20 NEEM Program Manufacturers | Field Visits in Washington, Oregon, and Idaho (19) |
April 03-March 04 |
| Total Homes | 29 |
It has been BAIHP’s experience that corrective measures from repeated moisture problem Diagnostics have been incorporated into the production process, resulting in thousands of improved manufactured homes. These are noted in Category D of Table 2.
A common problem that remains unresolved involves the combination of abundant crawl space moisture (Figure 63 and 64) and poorly vented skirting (Figure 65). In the hot-humid coastal regions, this combination raises vapor pressure across the belly to critical levels. This was evident in several of the homes visited this year. As a result of this field research, BAIHP has designed a study that was completed in the summer of 2004 to evaluate the moisture flow characteristics of crawl space conditions, and a second study in the summer of 2005. (See Crawl Space Moisture Research for HUD Code Homes section).
 |
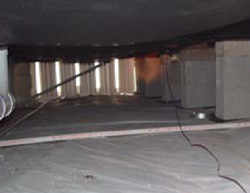 |
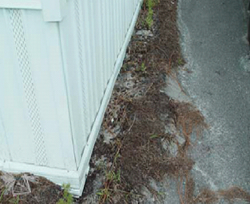
Figure 64. The
downstream exit for the water draining across the site via the crawl space. Note flow pattern away from house. |
Figure 65. HUD
Code required perforations in skirting may not allow adequate
volumes of ventilation, creating higher than usual vapor pressure
difference across the floor assembly even though the ground cover and belly board are in good condition. |
During the final year of the project, BAIHP staff worked with field staff of several HUD Code Home manufacturers as illustrated in Table 45. Palm Harbor Homes again had no moisture damage homes in the final year of the project; however, BAIHP researchers returned to the Southern Energy Homes plant in Addison AL to train field service personnel on use of blower door, duct tester, pressure measurements and infrared diagnostics.
Table 45. April 2005 - June 2006 – FSEC
Field Visits
to Problem Manufactured Homes
| Manufacturer | Location | # of Houses |
| Fleetwood Homes | Florida (4), Georgia (2) | 6 Houses |
| Southern Energy Homes | Mississippi and Louisiana | 4 Houses |
| Total Homes | 10 Houses |
Northwest BAIHP Field Visits to Problem Manufactured Homes
In offering technical support to owners of over 100,000 homes built since 1990, the BAIHP staff in the Northwest answers questions from homeowners, manufacturers, retailers and others. In The 6th budget period, staff from Washington, Oregon and Idaho responded to over 70 phone calls and conducted 27 field visits. The number of field visits to problem homes has significantly decreased over the history of the program, in large part because of manufacturers’ and installers’ increased adoption of the NEEM Super Good Cents/Energy Star (SGC/E-Star) specifications which include duct air tightness specifications (duct leakage is a major contributor to pressure and air flow related moisture problems), and the requirement that manufactured home installers be certified in Washington and Oregon.
Northwest BAIHP staff began to utilize Energy Gauge USA as a tool for evaluating high bill complaints in 2003-2004.
BAIHP staff participated in quarterly meetings of the Washington State Manufactured Housing Technical Working Group, which coordinates the certification of manufactured housing set-up crews.
While butyl duct tape is no longer allowed under current NEEM SGC/E-Star specifications, a consistent issue in the field continues to be excessive duct leakage, due in large part to failures of duct tape. These findings were brought to the attention of the NFPA-501 Manufactured Housing Standards Committee, resulting in a successful proposal to revise the duct sealing specifications to eliminate the use of duct tape in favor of better performing mastic and fiberglass mesh in the NFPA-501 standard. See a summary of supporting research findings in BAIHP Duct Data Compilation.
Super Good Cents Random Home Testing
In 1994-1995 (prior to implementation of BAIHP), SGC staff conducted field testing of 178 SGC homes built in 1992-1993. In 1999, the first year of the BAIHP effort, staff in Idaho and Washington field-tested 49 SGC homes built in 1997-98. In 2000, analysis of field test data confirmed some improvements to home set-up procedures and air leakage control, while highlighting a need to improve duct tightness and ventilation system operation (through homeowner education.) In 2001, BAIHP staff produced an updated homeowner ventilation brochure.
In 2002 and 2003, BAIHP staff worked with Ecotope to develop a valid sample for the next round of field testing, and began to develop the field testing protocol. In 2004, Ecotope selected 105 homes from the total production for the years 2001-2002. The field testing took place in the summer of 2004. Findings from the testing include:
In 2004, BAIHP staff conducted a billing analysis on a limited number of random field study homes. The conclusions (although not statistically significant) suggest that temperature related energy use in NEEM homes remains similar to previous larger studies on cost-effectiveness. The analysis attempted to evaluate total and space conditioning energy use by HVAC system types but was limited by small sample size.
In 2004, a sub-sample of homes that are believed to represent the best case for duct tightness was selected for additional field testing. These homes include those with in-plant tested ducts and thru-rim crossover duct systems. The goal of this effort is to establish a “tightest” duct case benchmark. Field testing was completed in 2005.
Blue Sky Foundation
Blue Sky Foundation, in coordination with FSEC, conducted an evaluation of energy efficiency and the moisture damage potential in 16 North Carolina homes in the summer of 2001. Blue Sky foundation proposed that the energy and moisture evaluation focus on the building envelope integrity, HVAC duct systems, and the moisture impact of unvented space heaters. All of the homes in the study were manufactured models located in Carteret and Craven counties, each located on the North Carolina coast. Field teams gathered additional energy and moisture information from homeowners.
Only three of the 15 tested homes recorded moisture and/or mildew problems. Because of the small sample size, the results are mostly anecdotal and would need to be evaluated within a larger data set. Planning for this is underway. Data from the summer field program as well as the final report are now on the BAIHP website (www.baihp.org) under Publications.
Cavalier Homes
BAIHP visited one Cavalier Home in Florida for a moisture damage investigation in response to home owner complaints of persistent air flow problems and floor damage. BAIHP made recommendations to correct the installation of the duct system and supply registers, repair the rodent barrier to make it air tight, do site work to reduce flooding under house, place a ground cover if site work done, increase crawl space venting, and replace damaged flooring with plywood. Cavalier Homes adjusted in plant procedures to ensure air tight duct construction completing 1,132 homes with this improvement in 2002. In the final year of the project, BAIHP visited the Cavalier Homes plant in Addison AL to discuss future research projects, review house construction of FEMA units, and discussed possible duct plenum construction problems in FEMA Houses.
Fleetwood Homes
(See also Fleetwood Homes under
Section II of this report “BAIHP
Technical Assistance.”)
During the 5th budget period, BAIHP continued to support
Fleetwood’s
service department making six visits to moisture damaged homes in Florida
(4), Texas (1), and West Virginia (1).
Six Fleetwood homes, all in Florida, were tested for moisture and mold
damage from April 2002 through March 2003, the 4th budget period. All
of the homes had damaged flooring due in part to a lack of ground cover
and poor crawlspace ventilation. Damage to the floor in one home was
exacerbated by a plumbing leak. Only one home had moisture damage to
the wallboard material, and this home showed a history of thermostat
settings below 72 F. A report for each home was submitted to Fleetwood
for corrective measures. One additional high bill complaint in Cobb,
Georgia was investigated during this reporting period.
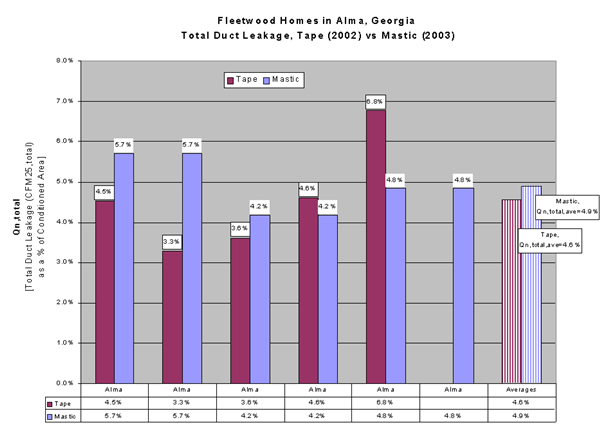
Figure 66. Testing Results
from Fleetwood Homes Plant in Alma, Georgia
illustrate that tape sealed
ducts can result in total duct leakage
under Qn=<6%.
This initial
tightness, however, is often eroded by adhesive failure.
In 2002, four Fleetwood factories in Southern Georgia were visited to investigate possible causes of moisture related building failures found in homes installed in hot, humid climates. The factories were located in Douglas, Alma, Pearson, and Willacootche. (Figure 66.)
Homes of Merit
(See also Homes of Merit under II BAIHP Technical Assistance.)
In 2002, researchers performed multiple diagnostic tests on a home located in Marathon, Florida that was experiencing “mold problems.” Researchers determined that the mechanical system was significantly oversized and that the home was operating under negative pressure when the system was operational. The home’s owner exacerbated humidity problems by leaving the fan in the “on” mode. On-site relative humidity readings showed that indoor and outdoor relative humidity were the same, approximately 70%.
Palm Harbor Homes
(See also Indoor Air Quality Study in this section and Palm Harbor
Homes under II BAIHP Technical Assistance.)
Palm Harbor Homes, James Hardie®, and FSEC performed two separate drywall assembly tests to determine the cause of some moisture damage occurring in homes sheathed with Hardipanel. Hobo dataloggers recorded temperature and relative humidity measurements inside the assembled panels on eight different wall panel configurations. (Figure 67)
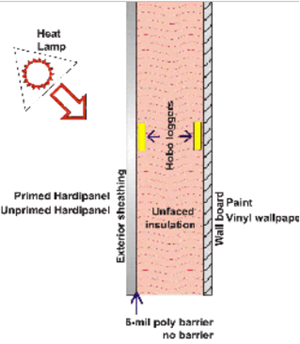 |
Figure 67. Wall assembly used
in
moisture transmission experiment. |
Results determined that the unprimed, unwrapped sheathing performed best. The painted drywall assemblies allowed the greatest moisture movement - or wall assembly drying. (Table 46) The vinyl-covered drywall held moisture longest, recording the slowest drying time. Adding perforations to the vinyl reduced the drying time.
Table 46. Hardipanel exterior wall configurations
| Test Panel | Drywall | Insulation | Wall Wrap | Sheathing |
| #1 | vinyl | unfaced | none | primed |
| #2 | vinyl | unfaced | none | unprimed |
| #3 | vinyl | unfaced | house wrap | primed |
| #4 | perforated vinyl | unfaced | none | primed |
| #5 | House wrap glued to drywall | unfaced | house wrap | primed |
| #6 | vinyl | unfaced | Thermo Ply | primed |
| #7 | painted | unfaced | none | primed |
| #8 | painted | unfaced | none | unprimed |
In 2002, two Palm Harbor homes with comfort problems were tested in Ocala and Okahumpka, Florida and one high bill complaint was investigated in Odessa, Florida. Duct leakage testing and infrared imaging revealed a duct disconnect near the attic crossover in the Ocala home. Inspections with the IR camera found no insulation problems in the Odessa home. Ductblaster and blower door tests revealed airtight duct and envelope systems. Other than an oversized air conditioning system, there were no obvious reasons for the high bills.
Paper: Withers, C., Chasar, D., Moyer, N., and Chandra, S. "Performance and Impact from Duct Repair and Ventilation Modifications of Two Newly Constructed Manufactured Houses Located in a Hot and Humid Climate", Thirteenth Symposium on Improving Building Systems in Hot and Humid Climates, May 20-22, 2002 Houston, Texas.
In 2001, the BAIHP team conducted research on two homes to define how tight ducts and a prototype Coleman® heat pump (proprietary technology) affect energy use and moisture control in a hot, humid climate. FSEC, in collaboration with Fleetwood Homes, York International Manufactured Housing Division (now Stylecrest Sales), and Coleman®, monitored two nearly identical side-by-side homes in Bossier City, Louisiana. The homes contained different air conditioning systems. House A used a standard split air conditioner, while House B used the Coleman® prototype unit (a more efficient, two-speed split air conditioner).
Figure 68 shows the reduced power draw of the two-speed compressor (green, dotted line) over a 24-hour period on September 2, 2000. With the unit operating at low-speed for most of the day, the cooling energy savings were 28% when compared to the energy use in House A. Average daily cooling energy was reduced by about 12% over the monitored period. An added benefit of the two-speed air conditioner was 20% greater moisture removal on days with an outdoor dewpoint above 60 F.
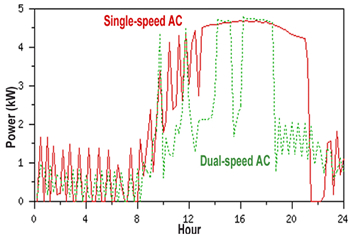
Figure 68. Power draw over a 24-hour period, September 2, 2000.
Savings from Duct Repair and POS Ventilation: In addition to comparing one house to the other, the BAIHP team also compared home performance before and after ductwork and ventilation system changes were made.
To make the comparison, duct and other leaks were sealed in both houses until the two were equally airtight. The ventilation method in each home also was changed from exhaust-only to a positive pressure system (POS). With exhaust-only ventilation, bathroom fans removed stale air from the home which caused fresh air to be pulled in through the building envelope. To simulate occupant use, two bath exhaust fans were operated by a timer for three hours in the morning and six hours in the evening.
Olympia, Washington
Technical Assistance by BAIHP Contractors Washington State University Energy Program, Oregon Office of Energy and Idaho Department of Water Resources, Energy Division
This 2600 ft2 home was built beyond SGC standards and incorporates Energy Star lighting and appliances. The home (Figure 69) has received significant national exposure through WSU campus and alumni newsletters, tours, the BAIHP website, and local and trade media including an article in the Automated Builder magazine and a feature by KING 5 News of Seattle.
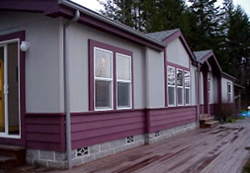 |
Figure 69. WSU Energy House
in Olympia, WA |
WSU staff uses the house to try out innovative technologies and testing methods. In 2003, BAIHP staff developed a moisture case study based on research at the WSU Energy House, published under a separate Building America project. The WSU Energy House has been monitored since 2000. Collected monitoring data includes weather, temperature, humidity, CO2, CO, and eight differential pressures. Energy use data is being collected for water heating, laundry, fireplace and heating, ventilating, and air conditioning (HVAC). Data from the house is available on the BAIHP web page (under Current Data) and has been presented to the building science, indoor air quality (IAQ) and HVAC research communities at conferences sponsored by ASHRAE, Air Infiltration and Ventilation Center (in the UK), HUD/NIST, NFPA, and BTECC.
Working with Ecotope, ASHRAE, and the Energy Conservancy, BAIHP staff conducted “Delta Q” and “nulling” duct leakage tests in 2001. Follow up pressure tests and analysis of test data conducted in 2002 indicate these tests are effective methods of measuring duct leakage in manufactured homes, and may be included in the upgrades to the National Fire Protection Association-501 standards for manufactured homes.
Blower door and duct leakage testing indicate very good whole house and duct air tightness (2.4 ACH50 and 61.6 CFM50out). Tracer gas testing demonstrated that the use of a furnace-based intake damper does not change the leakage rate of the home.
In 2004, moisture problems associated with siding and trim details were eliminated using and an improved window flashing system. The adoption of this system is currently under discussion with some manufacturers, and NFPA-501.
Nez Perce Fish Hatchery, Idaho
Category A, 1 home
Paper: Lubliner, M.; Gordon, A.; Hadley, A. (2004). “Manufactured Home Performance; Comparing Zero Energy and Energy Star”. Proceedings of Performances of Exterior Envelopes of Whole Buildings IX International Conference, Clearwater Beach, Florida, December 2004.
BPA, working with BAIHP staff in Idaho and Washington, provided funding for the most energy efficient manufactured home in the country. The RFP was sent to 18 Northwest manufacturers; Kit HomeBuilders West of Caldwell, Idaho was selected as the manufacturer of the home. BAIHP staff solicited 24 industry partners to provide energy efficient building components, including Icynene wall, floor and roof insulation, a low-cost HUD-approved solar system, sun-tempered solar design, and Energy Star© windows, appliances and lighting. Partners include Building America Team members such as Flexible Technologies, Icynene and LaSalle. Complete list of specifications provided in Table 47.
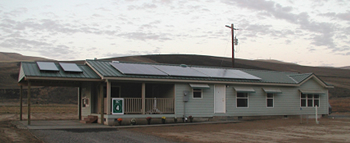 |
Figure 70. Zero Energy Manufactured
Home, on site at the Nez Perce Fish Hatchery |
The ZEMH (Figure 70) was built in the Fall of 2002 along with a control home. The ZEMH was displayed at the 2002 Spokane County Interstate Fair before siting at the Nez Perce tribal fish facility near Lewiston Idaho. Blower door and duct leakage tests at the plant and on-site indicate that this is the tightest home ever tested by BAIHP staff.
Working with FSEC and BPA, BAIHP staff installed monitoring equipment for the ZEMH. Monitoring began in the 2003 and includes the following:
Table 47. Zero Energy Manufactured Home (ZEMH) and Base Case Home (Control)
| Component | ZEMH | Base |
| Wall Structure | 2x6 ft, 16 in on center | Same |
| Wall Insulation | R21 foam-spray | R21 batt |
| Floor Structure | 2x8 ft, 16 in on center | Same |
| Floor Insulation | R33 (R22 Foam + R11 batt) | R33 Blown Cellulose |
| Vented crawl space wall | R14 foil faced foam | None |
| Roof/Attic Structure and Finish | 16 in on center 40 lb roof load 4/12 pitch metal roofing |
24 in on center Standard 30 lb roof load Same pitch and finish |
| Roof/Attic Insulation | R49 foam | R33 blown cellulose |
| Window/Floor area ratio | 12% | Same |
| Windows | Vinyl Frame, Argon filled, low-e, Energy Star Approved | Same |
| Window Shading | Dual blinds, heavy drapes, awnings | Single blinds, light drapes |
| Doors | U=0.2 metal, foam w/thermal break | Same |
| Solar | Solar ready design (mounts, flashings
and electrical chase) 4.2 kW peak rated PV system with a 4 kW inverter and 12 kWh battery array |
None |
| HVAC | 2 ton unitary air-source heat pump 12 seer, 7.8 HSPF |
Same |
| Zone heat | 150 W Radiant Panel in kitchen | None |
| Ducts and cross over | R8 crossover Flex Flow crossover system Mastic with screws More efficient duct design |
R8 crossover Sheet metal elbows Standard foil tape |
| Lighting | 100% Energy Star T8 and CFL fixtures | T12 and Incandescent fixtures |
| Appliances | Energy Star washer and dryer, refrigerator, dishwasher | Standard equipment |
| Whole House Ventilation | Heat Recovery Ventilator w/HEPA, continuous operation (turned off in 8/04) | Quiet (low-sone) Energy Star exhaust fan, continuous operation |
| Spot Ventilation | Energy Star bath fans, std. Kitchen fan | Quiet (low-sone) bath fans, std. Kitchen fan |
| Ceiling Fans | Energy Star with dimmable CFL | Standard with Incandescent bulbs |
| Domestic Hot Water | PV controlled, active anti-freeze solar water system, with 80 gallon storage, and 64 ft2 of collector area solar pre-heat tank (pre-plumbed), 40 gallon standard tank EF=0.93 | EF=0.88 standard electric |
| Air Sealing | Wrap with tape flashing Marriage line gasket (new product) Penetrations sealed with foam insulation |
Wrap without tape flashing Standard practice marriage line sealing |
| Air/Vapor Barrier | Walls and Ceiling: Painted Drywall Floor: Floor decking |
Same |
Data logger collects 15 minute data from wired sensors and transmits daily to the host computer at FSEC via modem. Summary data reports are available at www.baihp.org under “Current Data.” Plug-type loggers were installed in mid March 2003 to sub-meter the energy use of the refrigerator, freezer and clothes washer in each home, as well as the radiant heat panel and HRV in the ZEMH. Data from these loggers was collected by occupant readings in mid-December 2003.
Findings
Measured net energy use of the ZEMH is 6% lower than the base home, not normalized for occupant behavior. This also does not take into account the fact that the ZEMH’s PV system was only fully operational for one month.
The ZEMH required 45% less space heating energy, possibly due to improved building envelope measures, and the lack of consistent HRV operation.
The measured envelope leakage in the ZEMH was 2.0 ACH50, much lower than the base home (indeed, lower than any other NEEM home tested in the field) and substantially tighter than typical HUD code homes.
The ZEMH total duct leakage was 46% lower than the base home; leakage to the outside was 405% lower than the base home. The BAIHP staff speculates that the unprecedented low leakage to the outside value is the result of the ducts in the ZEMH being located within the conditioned space, and effectively within the pressure envelope of the home, surrounded as they are by foam insulation.
The solar water heating system in the ZEMH provides most, if not all of the hot water needed during the summer months, and roughly 45% of the total hot water demand. The PV system with net metering provides 38% of the total ZEMH energy use.
The project highlights the importance of occupant choices and behavior on the performance of energy efficient housing. Based on the preliminary monitoring data and occupant surveys, the behavior patterns of the ZEMH occupants are not themselves “energy efficient”. These patterns create the appearance of a less efficient home. On the other hand, the behavior of the ZEMH occupants may shorten the payback for the innovative technologies of the ZEMH.
BAIHP staff also performed a benchmarking analysis on the ZEMH, as part of the overall benchmarking effort. The ZEMH reached a level of 60% above the NREL prototype, which indicates the difficulty of obtaining a high benchmarking score.
In December of 2004, a research paper was presented at BTECC which provided a preliminary evaluation of the ZEMH performance without the full operation of the PV net metering system.
Follow up
In December of 2005, dataloggers were installed to collect two minute interval data for the Idaho ZEMH and base case home. One week of data using the Insider heat pump was gathered, paying special note to the defrost cycle power usage and the effect that the unit’s crawl space air flow changes conditions in the crawl space. This data was compared to a week of data from an electric strip heater
Plant City, Florida, and FSEC MHLab
Papers: Hodgson, A.T., Apte, M.G., Shendell, D.G., Beal, D. and McIlvaine, J.E.R. (2002a).
Implementation of VOC source reduction practices in a manufactured house and in school
classrooms. In Levin, H. (Ed.), Proceedings of the 9th International Conference on Indoor Air
Quality and Climate. Indoor Air 2002, Santa Cruz, CA, Vol. 3. pp. 576-581.
Hodgson,
A.T., D. Beal and J.E.R. McIlvaine. 2002b. Sources of formaldehyde, other
aldehydes
and terpenes in a new manufactured house. Indoor Air12: 235-242.
Hodgson,
A.T., A.F. Rudd, D. Beal and S. Chandra. 2000. Volatile organic compound
concentrations and emission rates in new manufactured and site-built
houses. Indoor Air10:
178-192.
This is a summary of several indoor air quality (IAQ) projects designed to improve the IAQ of manufactured homes; specifically to find ways to reduce the formaldehyde levels found in manufactured homes. This was a collaborative effort of the Florida Solar Energy Center (FSEC), Lawrence Berkeley National Laboratory (LBNL) and Palm Harbor Homes, Inc. (PHH), a leading nationwide producer of multi-section, high-end, manufactured houses with corporate offices in Addison, TX.
In 1999 – 2000 a study was conducted to identify and verify the major sources of formaldehyde, aldehydes, and terpene HCs in a new manufactured house. Laboratory emission tests were conducted with a number of wood and engineered wood products and aldehyde and volatile organic chemical (VOC) measurements were made in the house. Although only a single house was studied, the information on sources is anticipated to have broad application to residential construction due to the widespread use of similar materials and building practices.
The manufactured house was typical of better quality two-section houses produced in Florida. It was completed in November 1999. Within three weeks of manufacture, it was installed at a nearby site. The house was used daily as a sales model. It was decorated, fully furnished, but unoccupied. There were three bedrooms and two bathrooms.
The manufacturer supplied a detailed list of materials used in the house. Between December 1999 and January 2000, ~30 specimens of the major materials were collected from the production facility. These were cataloged, packaged in aluminum foil, and shipped to the laboratory by airfreight. The specimens were stored at room conditions in their original packages until they were tested. Most materials were tested within three months of collection. Measurements were made after about a 3-week exposure, and area-specific emission rates (i.e., emission factors) were calculated.
Air sampling in the house and outdoors was conducted in March 2000. The house ventilation rate was quantified concurrently by tracer gas decay. The ventilation rate measurement and the VOC air sampling and analytical methods for field and chamber work have been described previously (Hodgson et al., 2000)
Whole-house emission rates for combined materials were predicted based on the emission factors and the corresponding material quantities. These predicted values were compared to whole-house emission rates derived from measurements of VOC concentrations and ventilation rates. For 10 of the 14 target compounds, including formaldehyde, the predicted and derived rates agreed within a factor of two, which considering the uncertainties involved is considered good agreement. The predominant sources of formaldehyde in the house were bare particleboard (PB) and medium density fiberboard (MDF) surfaces in the cabinetry casework and molded high-density fiberboard doors. The plywood subfloor under the carpet was a smaller source of formaldehyde and the major source of higher molecular weight aldehydes and terpene hydrocarbons.
Table 48. Recommended VOC Source Reduction Practices For New House Construction
| No. | Source Reduction Practice |
| 1 | When alternates exist, avoid wood products with urea-formaldehyde resin system |
| 2 | Construct cabinet cases with fully encapsulated wood products |
| 3 | Use frameless cabinets to eliminate MDF stiles |
| 4 | Apply laminate backing sheet to undersides of PB countertops |
| 5 | Use alternate low-formaldehyde emitting passage doors |
| 6 | Apply barrier material over plywood subfloor in carpeted areas |
In 2004 a pilot demonstration project was conducted at PHH’s production facility and sales office in Plant City, FL. The project was originally conceived in 2002 as a side-by-side demonstration of simultaneous improvements in energy performance and IAQ to be achieved using existing technologies. The concept was to build two houses, essentially identical with respect to their size, floor plan, and major materials. One house would have added features to improve energy performance and IAQ. The other house would have no special modifications and would serve as the control. They would be sited in a residential community on adjacent, identical lots. Both would have computer-simulated occupancy (i.e., controlled use of lights, appliances, heating and cooling). Monitoring of energy usage and performance and IAQ metrics would be conducted over at least a one-year period. Finding the appropriate residential site and the funds needed to cover the costs associated with maintaining the houses at the site for a year proved difficult. Consequently, the study plan was modified in 2003 to reduce costs and take advantage of PHH’s model home sales office in Plant City.
Approximately on an annual cycle, PHH builds examples of their new houses for display at their sales office. The houses present PHH’s range of models and features. They are decorated and furnished, but unoccupied. The houses are open to the public during normal business hours seven days a week and their heating and cooling systems are operated accordingly. The use of these houses as study houses has some limitations. The houses generally vary somewhat with respect to size and floor plan, interior finishes and furnishings may vary, orientation with respect to sun and wind may vary, monitoring instrumentation must be kept out of sight, and sampling can only be conducted outside of normal business hours. In addition, computer controlled simulations of occupancy are not possible.
To the extent possible, the study plan was revised to accommodate these
factors.
In June 2003, two model houses, then in the planning stage, were selected
for use in the project. A 1,440-ft2, double-wide house designated as “Monte
Carlo” was selected to receive the energy and IAQ modifications.
A 1,540-ft2 double-wide house designated as “Edison 2” was
selected to serve as the primary control house. The houses were to be
installed on nearby lots in the sales center in approximately the same
orientation.
Table 49. Revised IAQ Specifications
| Component | Specification |
| Cabinet Construction | Medium-density fiberboard (MDF) face frame material and vinyl-two-sides (V2S) particleboard for all casework |
| Countertops | Construct all countertops with V1S particleboard with vinyl surface on underside of tops |
| Carpeted Floors | Install Tyvek (Dupont) house wrap over plywood subfloor before installing carpet. Use Nylon 6,6 carpet and synthetic fiber carpet cushion (both CRI Green Label) with standard tack strips with unquantified emissions of formaldehyde |
| Wall & Ceiling Paint | Use low VOC interior paints (Sherwin-Williams Harmony brand) |
| Passage Doors | Standard molded high-density fiberboard |
| Trim | Use wood lumber trim throughout house; avoid use of MDF trim |
| Recessed Light Fixtures | Install gasketed light fixtures |
The two houses were produced in late July and early August 2003. Installation of the two houses was completed and the heating and air conditioning (HAC) systems were operational by the end of September.
Energy Gauge ratings of the experimental house (Monte Carlo) and the control (Edison) showed that the control house was an Energy Star home, scoring 86.5, while the experimental house was a Building America house, scoring 91.1. There were many obstacles to successfully retrieving data from the houses, but available results show that the BA house saved about 50% more air conditioning energy than the control house. Figure 71 illustrates this. The plot normalizes the data by plotting the daily air conditioner energy use pre ft2 of conditioned space versus the average daily temperature difference between the inside and the outside (Average Daily )T).
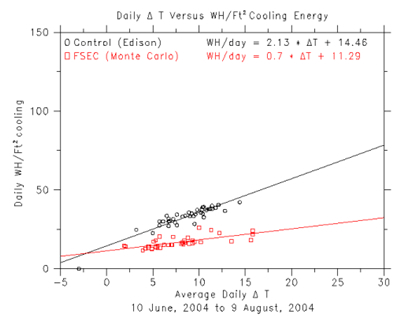
Figure 71.
IAQ work started with an initial set of active air samples for VOCs and aldehydes collected outdoors and in the Study and Control houses on December 11, 2003, approximately 2.5 months after the houses were fully operational. The second set of active samples was collected three months later on March 2, 2004. Passive aldehyde samples were obtained in the Study and Control houses and in an additional triple-wide house of the same age over four one-week intervals between these dates.
There were some distinct differences between the concentrations measured in the two houses. Notably, the concentrations of formaldehyde in the Study house were about three times higher than concentrations in the Control house. This difference was not anticipated based on the source reduction measures aimed at lowering the emissions of formaldehyde in the Study house.
Based on previous laboratory measurements of formaldehyde emissions from interior components, we anticipated a minimum 25% reduction in the formaldehyde emission rate in the Study house relative to the Control house. This was anticipated due to the use of fully encapsulated particleboard for the cabinetry casework, a diffusion barrier on the undersurface of the particleboard countertops, and the weatherization barrier applied over the plywood subfloor (Hodgson et al., 2002b). We additionally expected the difference to persist over the course of a year. The two-fold higher formaldehyde emissions in the Study house prompted us to abandon our original plan of quarterly measurements and instead to focus on identifying the unexpected source of formaldehyde emissions in this house. Firstly, FSEC and PHH staff jointly inspected the houses. This inspection confirmed that the intended formaldehyde source reduction measures had been implemented in the Study house.
Two other potentially relevant differences between the houses were known at the time. Due to the energy efficiency specifications for the Study house, a different manufacturer than the HAC system in the Control house produced the HAC mechanical system in the house. Secondly, some furniture believed to be solid wood had been newly purchased for decoration of the Study house. Older furniture taken from PHH’s stock was used to decorate the Control house.
In July 2004, the potential for the HAC systems to emit formaldehyde
was investigated. Each system is located in a closet near the central
living area. Active sampling for formaldehyde was conducted in each house.
The differences between the return and supply measurements were small,
about plus 3% for the study house and about minus 8% for the control
house. These differences are within the uncertainties of the measurements
and, therefore, are not significant.
Another inspection revealed that some of the backsides and undersurfaces
of the new wood furniture were fabricated from particleboard, a typically
high formaldehyde emission source (Kelly et al., 1999; Hodgson et al.,
2002b). Due to delays imposed by PHH model center needs and 2004’s
hurricane season, in December 2004, approximately 14 months after the
furniture was first delivered, we located the furniture pieces in a storage
garage. From one accessible piece, we obtained 4.4-cm diameter specimens
of 3-mm thick particleboard using a hole-saw. Specimens of 13-mm thick
particleboard were similarly collected from a furniture piece that was
several years old and was used in the sunroom of the house.
The emissions of formaldehyde from the two specimens of furniture particleboard individually were measured in the laboratory using small-scale environmental chambers as described by Hodgson et al. (2002b).
From the purchase requisition and the company’s sales literature it was determined there were eight new pieces of living room and master bedroom/retreat furniture that likely contained some particleboard. The total exposed surface area (one side) of particleboard in these pieces was estimated to be 8.5 m2. Thus, the estimated formaldehyde emission rate attributable to the new furniture was about 80% of the total formaldehyde emission rate derived for the house in December 2003. Based on the formaldehyde emissions from the particleboard from the older furniture, it is likely that the formaldehyde emissions attributable to furniture would have been substantially lower if older furniture pieces had been used.
This study did not progress as originally intended, and the results did not conclusively show the efficacy of low-cost measures intended to reduce the sources of formaldehyde in the Study house. However, it is likely that the source of the elevated formaldehyde emissions was correctly identified to be a component of the new wood furniture installed in this house and not in the Control house. If one-half the estimated formaldehyde emission rate from the new furniture (i.e., approximately the difference between the emissions from new and old furniture particleboard) is subtracted from the whole-house emission rate, the formaldehyde emission rate in the Study house is nearly equivalent to the rate in the Control house.
A formaldehyde concentration of 50 ppb and below has been suggested as a reasonable target for new houses (Sherman and Hodgson, 2004). The source reduction measures directed toward other VOCs were successfully demonstrated. The use of the weatherization barrier applied over the plywood subfloor in the Study house appeared to function as predicted to reduce the emissions of higher molecular weight aldehydes and terpene hydrocarbons from this source, and the use of the low VOC interior paint reduced the emissions of a major VOC component associated with latex paints.
Data collection was curtailed by the onset of 2004’s hurricanes, three of which impacted Plant City, and sales activity resulting in houses moving. The collected data did show that the energy goals established for the house were met, with a 50% reduction of energy use for air conditioning compared to the control house.
FSEC, Manufactured Home Laboratory
Paper: Moyer, Neil, Chasar, Dave, Hoak, Dave, Chandra, Subrato, "Assessing Six Residential Ventilation Techniques in Hot and Humid Climates," Proceedings of ACEEE 2004 Summer Study on Energy Efficiency in Buildings, American Council for an Energy Efficient Economy, Washington, DC, August 2004. (Also available online at www.baihp.org under Current Data and Publications
Ventilation Study
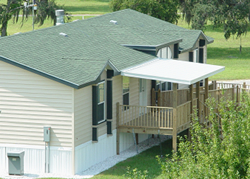 |
Figure 72. Manufactured
Housing Laboratory at FSEC (above and below) was site for study
of six residential ventilation systems. |
 |
The MHLab (Figure 72) is a research and training facility of 1600 ft2. This Energy Star® manufactured home has two separate heating and cooling systems:
1. An overhead duct system connected to a package unit air conditioner with electric resistance heating.
2. A floor-mounted duct system connected to a split system air conditioner, also with electric resistance heating.
Only the floor mounted duct system was used in these ventilation experiments.
Introduction
Ventilation is a HUD code requirement. The goal of ventilation is to add fresh air to the home. This may be accomplished by supplying outside air to the house or mechanical system, exhausting air from the house (which consequently pulls air into the house through joints in the walls, floor, and ceiling), or a combination of the two.
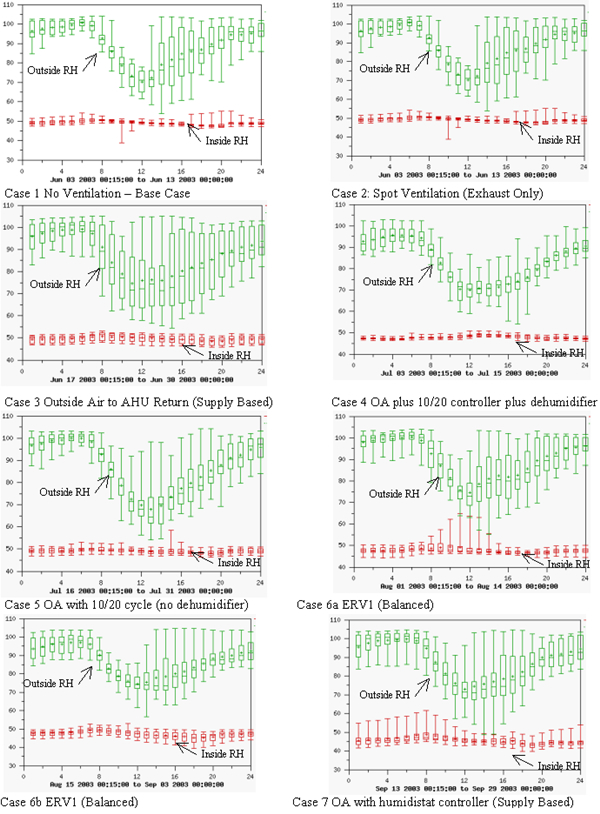
Supply based ventilation tends to slightly pressurize the home whereas exhaust based ventilation does the opposite slightly depressurizing the house. The disadvantage of supply based ventilation is that it forces conditioned air into the floor, wall, and ceiling cavities, possibly leading to condensation or mold growth in cold climates and during the heating season. Likewise the disadvantage of exhaust systems is that they pull unconditioned outside through the floor, wall, and ceiling cavities into the conditioned space, possibly leading to condensation, mold growth, or uncomfortably high indoor humidity levels in hot and hot-humid climates and during the cooling season. The six residential ventilation strategies evaluated are described in Table 50.
House Operation and Experimental Procedure
Occupancy Simulation: Automated computer controlled devices, such as appliances, showers, and lighting, simulate the sensible/latent heat generation and carbon dioxide (CO2) production of a family of four persons with periodic showers, cooking and cleaning.
The simulated latent occupancy load from breathing, bathing, cooking, and laundry was achieved by adding 14 to 15 pounds of water per day based on documentation of "average" household operation based on ORNL research conducted by Jeff Christian. Water vapor was injected into the space using a vaporizer at a rate of approximately 0.4 lbs per hour continuous and an additional 0.4 lbs per hour during the evening hours.
Table 50. Ventilation Strategies Studied in the MHLab
| Case (Name) |
Strategy | Descripton |
#1 |
No mechanical ventilation | Base Case scenario included only the heating and cooling system of the home with no outside air (OA) ventilation. |
#2 (Spot) |
Spot ventilation (exhaust only) | Bathroom and kitchen exhaust fans. Operation scheduled for 30 minutes after a simulated moisture producing event such as a shower or oven use. |
#3 (OA) |
Outside air (supply based) | Dedicated, filtered outside air duct to return plenum when the heating or cooling system is operating. Quantity of ventilation air provided depends on air handler run-time. |
#4 (Dehumid) |
Outside Air plus 10/20 Cycle and Dehumidification (Supply Based) | Same as #3, except with an added air handler fan controller (10-minute “on” - 20-minute “off” minimum duty cycle). Provides scheduled ventilation when no cooling or heating is called for. A stand alone room dehumidifier (set to approximately 50% RH) located in vicinity of the return air grill. |
#5 (10/20 Cycle) |
Outside Air plus 10/20 cycle (Supply Based) | Same as #4, except without the room dehumidifier. |
#6 (ER V1) (ER V2) |
Energy recovery ventilator (ER V1, ER V2) | Two different enthalpy transfer media were used. Outside air was drawn in through the ERV at a rate to meet the ventilation requirements. |
#7 (Hstat) |
Outside Air plus Humidistat (Supply Based) | This is a modified air handler fan speed control. When dehumidification is needed, the air handler fan is operated at lowest speed for enhanced latent control. A higher speed is selected when sensible cooling is needed. Ventilation air supplied via an outside air duct, with air handler fan operation controlled as in #4. |
Ventilation Rate: Researchers conducted whole house air tightness tests using sulfur hexafluoride as a tracer gas for a decay analysis (Figure 73) to determine if each ventilation strategy met the ASHRAE 62-2 Ventilation Standard during the test period. The spot ventilation strategy (#2) did not meet the standard on a daily basis as the runtime was not long enough. The outside air method (#3) was marginal in meeting the standard. Strategies #4-#7 met the standard.
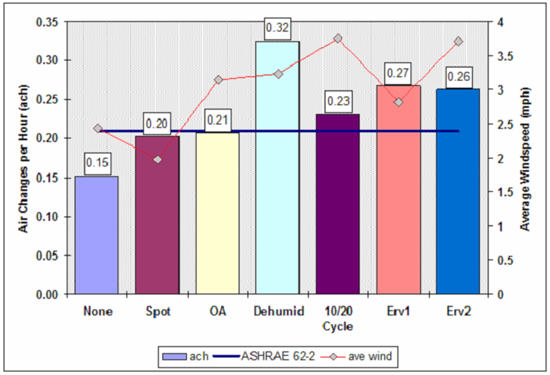
Figure 73. Results of tracer gas decay testing indicating
operational infiltration
(house not under test pressure) rates measured
for each ventilation strategy.
ASHRAE
Standard 62.2 was the target ventilation rate, not met by Spot or
OA strategies.
Note: Wind speed averaged over 2 hour infiltration test.
Whole House and Duct Air Tightness: The average whole house air leakage (CFM50) was 1224 (ACH50 of 5.4). The target normalized duct leakage is Qn#6%, where Qn=CFM25/conditioned area, this is the same as the duct leakage target in the Manufactured Home Energy Star program. The total duct system leakage in the MHLab Qntotal=5% (CFM25total = 75) with leakage to the outside measured to be Qn(out)=3% (CFM25out = 45), well under the leakage target.
Interior temperature and relative humidity: A digital thermostat maintained interior temperature at 75º degrees Fahrenheit. Interior temperature and relative humidity sensors are located on the same wall as the thermostat, at approximately the same height from the floor. Dedicated interior relative humidity control was only available with the dehumidifier strategy, and was a byproduct of cooling coil operation in the other strategies.
Cooling/ventilation power usage
With all mechanical ventilation systems, additional energy use from both
increased conditioning loads and fan (if present) power is expected.
The split system with the floor duct system is a 12 SEER system with
a rated cooling capacity of 30.2 kBtu. The ventilation strategies that
required the use of the air handler fan, an energy recovery ventilator,
or the dehumidifier had the energy use added to the cooling energy. The
dehumidifier strategy did use the most energy for cooling; however, it
should be noted that this test occurred during the hottest ambient conditions.
Table 51. Average Ambient and Building Conditions
Case 1 None |
Case 2 Spot |
Case 3 OA |
Case 4 Dehumid |
Case 5 10/20 |
Case 6 ERV1 |
Case 6 ERV2 |
Case 7 Hstat |
|
| Indoor Temp (°F) | 74.5° |
74.5° |
74.7° |
74.9° |
74.0° |
74.1° |
74.4° |
74.8° |
| Indoor Temp Max (°F) | 75.0° |
75.2° |
75.5° |
76.0° |
75.0° |
74.9° |
75.4° |
76.0° |
| Indoor RH (%) | 49.2% |
45.7% |
49.5% |
47.9% |
49.1% |
47.8% |
47.2% |
45.7% |
| Indoor Dewpoint (°F) | 52.4° |
54.2 |
54.5 |
53.9 |
53.7 |
53.1 |
53.0 |
52.4 |
| Outside Temp (°F) | 78.6° |
78.6° |
78.4° |
82.1° |
79.8° |
79.3° |
80.8° |
79.2° |
| Outside RH (%) | 89.2% |
79.5% |
87.7% |
83.4% |
87.0% |
90.0% |
86.9% |
88.1% |
| Δ Temp (°F) | 4.3° |
4.0° |
3.7° |
7.1° |
5.8° |
5.1° |
6.5 |
4.4 |
| Δ Dewpoint (°F) | 18.6° |
20.7° |
19.5° |
22.4° |
21.4° |
22.7° |
23.3° |
22.6° |
| Solar Rad. (kWh/m2) | 53.5 |
107.3 |
68.9 |
76.3 |
86.8 |
66.3 |
101.9° |
77.1° |
| Rainfall (Inches) | 3.6 |
0.5 |
4.7 |
0.1 |
4.0 |
5.1 |
3.2 |
4.9 |
| Condensate (lbs) | 617 |
905 |
920 |
1131 |
1118 |
1034 |
1685 |
1282 |
| Δ P WRT Out (Pa) | -0.2 |
0 |
0.1 |
0.4 |
0 |
-0.2 |
-0.2 |
0.1 |
| Minimum RH | 42.1% |
38.8% |
45.8% |
46.2% |
46.3% |
44.2% |
39.3% |
39.7% |
| Maximum RH | 53.3% |
55.2% |
53.2% |
51.0% |
58.4% |
64.8% |
53.0% |
61.4% |
| Mean RH | 46.1% |
49.2% |
49.5% |
47.9% |
49.0% |
47.8% |
47.2% |
45.7% |
| RH Standard Deviation | 1.272 |
1.471 |
1.673 |
0.845 |
1.231 |
2.194 |
2.108 |
3.07 |
| RH Range | 11.2% |
16.3% |
7.4% |
4.8% |
12.1% |
20.6% |
13.7% |
21.7% |
Findings
The cooling energy required to maintain the 75°F interior set-point appeared to vary as a result of the temperature difference across the envelope (Table 51). A linear regression analysis was performed to compare energy use of the ventilation strategies as a function of temperature difference across the envelope (Table 52). The power use at the average temperature difference of five degrees Fahrenheit is shown in bold.
As might be expected, interior relative humidity had the least variance with the dehumidification system with a low of 46% and a high of 51% (Table 51 and Figure 74). The best performing system, Case 4 (10/20 cycle plus dehumidifier), was able to maintain the relative humidity at a nearly constant level for almost 80% of the test period. The next best performer was Case 2 (spot ventilation). Humidity levels during the test period are graphed in Figure 74.
Table 52. Cooling and ventilation power (watts) usage
as a
function of temperature difference across the building envelope
ΔTemp
(°F) |
Case
1 None |
Case
2 Spot |
Case
3 OA |
Case
4 Dehumid |
Case
5 10/20 |
Case
6 |
Case
7 Hstat |
|
ERV1 |
ERV2 |
|||||||
-5 |
487 |
499 |
475 |
499 |
411 |
459 |
367 |
526 |
0 |
924 |
911 |
949 |
1046 |
863 |
915 |
880 |
1006 |
5 |
1361 |
1324 |
1424 |
1592 |
1315 |
1370 |
1393 |
1485 |
15 |
2236 |
2150 |
2372 |
2685 |
2219 |
2280 |
2418 |
2443 |
Figure 74. Average hourly relative humidity profiles for each strategy
Conclusions
The operation of a correctly sized air conditioning system with a supplemental dehumidification system to pre-condition the outside air and provide additional dehumidification of the space appears to provide the best interior humidity control (Table 52, in bold) with only a slight increase in energy usage – about 200 watts (Table 53). This is represented by Case 4 of this study. Only this strategy was able to maintain the interior humidity conditions in a range of less than 5% (Table 53, in italics).
Though all of the strategies did provide some humidity control over the test period, it is most likely a result of the run time afforded by the correctly sized air conditioning system and the consistent simulated interior sensible load. When an air conditioning system operates for extended periods of time, the removal of moisture from the air stream is enhanced (Khattar, Swami & Ramanan 1987).
In the final year of the project, researchers began installation of Building Science’s ACDM (Advanced Cooling with Dehumidifier Mode) heat pump forced air system and monitoring equipment in the Manufactured Housing Lab in April of 2006. The duct system was modified to accept the new unit, the package unit removed and the new heat pump system installed. An alternate method of measuring condensate by using a condensing furnace condensate pump with a modified pump on the sensor was developed and tested.
Also, all BA teams were surveyed on their current ventilation practices in November 2005, and the summary was presented at the BA team meeting in December. Members discussed conducting new experiments to quantify ventilation efficiency of various ventilation strategies with Building Science Corp. and NREL.
Paper: W. Mark McGinley, Alaina Jones, Carolyn Turner, Subrato Chandra, David Beal, Danny Parker, Neil Moyer, and Janet McIlvaine. Optimizing Manufactured Housing Energy Use. Symposium on Improving Building Systems in Hot and Humid Climates, Richardson, Texas, May 17-19, 2004.
Side-by-side monitoring of two manufactured homes at North Carolina
Agricultural and Technical State University (NCA&TSU), evaluated
the value of a variety of energy saving technologies and techniques. (Figure 75 and Table 54) Home
instrumentation measured energy consumption as well as interior and
exterior climatic conditions. The “standard home,” designed and built to basic
HUD code requirements, represented the control home. Modified to use at least
50% less energy, the “energy home” met Building America standards.
Cooperating researchers at NCA&TSU and FSEC investigated energy
feature performance and compared actual energy used to energy modeling
program predictions. In-situ energy performance data provided researchers
with interesting information on both issues.
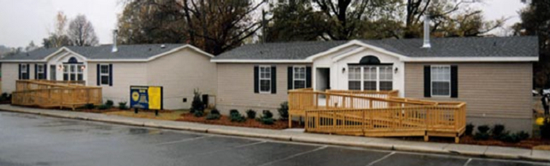
Figure 75. Side-by-side monitoring of manufactured homes at NCA&TSU.
Each model contained 1,528 ft2 of living area with nearly identical floor plans. Though the homes were unoccupied during the testing, home lighting and water heating use was simulated with timers. A datalogger in each home recorded: (1) the interior and exterior temperature and humidity along with solar radiation and wind speed, (2) the home’s total power consumption, (3) the air conditioning/heat pump compressor, air handler fan, and electric resistance heater use (primary heater in the standard house, backup or emergency heater for the energy house), and (4) water heating and water usage data.
The energy house features combined higher insulation values, improved windows, centralized and airtight duct design, high efficiency heat pump, and a solar water heater. Feature-by-feature construction differences are highlighted in Table 54.
Table 54. Specifications of Standard and Energy Construction
| Characteristic | Standard House | Building America House |
| square footage | 1528 | 1528 |
| floor insulation | R-11 | R-22 |
| wall insulation | R-11 | R-13 |
| ceiling insulation | R-20 | R-33 + roof deck radiant barrier |
| windows | single pane with interior storm | low-E double pane |
| exterior doors | storm door on front | storm door on all |
| marriage wall seal | fiberglass pad | SOF-SEAL® gasket |
| heating system | resistance electric | heat pump HSPF 7.5 |
| cooling system | central air conditioning SEER10 | central heat pump SEER12 |
| system size | 3 tons | 2 tons |
| water heating | electric water heater – 40 gallon | solar water heater – 66 gallon |
| duct joints | industry standard | sealed with mastic |
| duct leakage | *CFM5out = 145 | CFM25out = 83 |
| house leakage | **ACH50 = 10 | ACH50 = 9 |
| *Cubic feet per minute **Air changes per hour | ||
Data collection on the two homes began in early January 2001. Palm Harbor Homes in Siler City manufactured both homes, the results for program year three and four are detailed below.
Year 4 Side-by-Side Monitoring Results
During Phase 2, modifications were made to the solar water heating
system in the energy efficient housing unit to help improve the performance
this system. Further, a number of the incandescent light bulbs in the energy
unit were replaced with compact fluorescent bulbs. These changes were staged
to allow an evaluation of the effect of each measure on the home’s energy
use.
Based on investigative results, it can be concluded that:
The total measured energy used by each of the housing units for cooling and heating are shown in tables below. Table 55 shows the energy used for heating and cooling the standard housing unit from January through August of 2002. The standard home datalogger was struck by lighting in mid-August 2002. Data after this point was not included since only partial data is available and performance comparisons were not possible. Table 56 shows a summary of the cooling and heating energy used by the energy housing unit. Tables 57 and 58 list the energy use for hot water production for the standard and energy units, respectively.
Table 55. Cooling and Heating Energy Use, Standard House Actual Values (kWh)
SEP |
OCT |
NOV |
DEC |
JAN |
FEB |
MAR |
APR |
MAY |
JUN |
JUL |
AUG |
|
Phase 1 |
492.4 |
447.6 |
648.6 |
1741.1 |
2495.3 |
849.6 |
628.8 |
384 |
566.3 |
990.8 |
852.9 |
1066 |
Phase 2 |
2120.2 |
1717.1 |
1227.6 |
502.0 |
438.0 |
939.4 |
1079.4 |
511.2 |
Table 56. Cooling and Heating Energy Use, Energy Star House
|
|
SEP |
OCT |
NOV |
DEC |
JAN |
FEB |
MAR |
APR |
MAY |
JUN |
JUL |
AUG |
Phase 1 |
337.3 |
205.7 |
150.8 |
452.8 |
1087.3 |
472.8 |
426.9 |
184.8 |
528.3 |
891.5 |
850.9 |
671.6 |
Phase 2 |
680.7 |
537.1 |
378.1 |
241.9 |
311.8 |
603.0 |
668 |
626.6 |
Table 57. Domestic Hot Water Use, Standard House
|
|
SEP |
OCT |
NOV |
DEC |
JAN |
FEB |
MAR |
APR |
MAY |
JUN |
JUL |
AUG |
Phase 1 |
197.8 |
267.7 |
250.2 |
212.6 |
0 |
0 |
217.6 |
244.9 |
258.1 |
227.5 |
207.9 |
213.5 |
Phase 2 |
294.6 |
280.9 |
283.2 |
264.9 |
280.2 |
192.2 |
200.3 |
85.2 |
Table 58. Domestic Hot Water Use, Energy Star House
|
|
SEP |
OCT |
NOV |
DEC |
JAN |
FEB |
MAR |
APR |
MAY |
JUN |
JUL |
AUG |
Phase 1 |
133.4 |
176.2 |
204.2 |
189.9 |
0 |
0 |
245.5 |
184.4 |
183.0 |
141.2 |
152.3 |
126.6 |
Phase 2 |
251.1 |
212.0 |
202.8 |
145.9 |
157.3 |
74.8 |
80.3 |
83.0 |
Also listed in each table are the monthly energy use values measured during the first phase of this investigation, January through August 2001. Please note that the energy housing unit data prior to August 2001 is suspect due to duct and HVAC system problems later corrected. The entire data set, including, temperature, relative humidity, solar radiation, and power use is listed on the FSEC web site www.infomonitors.com.
The total energy used for water heating and central cooling over the period of August 1 through August 15 was 363.5 kWh for the energy home and 596 kWh for the standard home. This represents a 40 % reduction in energy use between the two homes.
The total energy used over the period of August 1 through August 15 for water heating was 27.13 kWh for the energy house and 85.18 kWh for the standard home. This represents a 68% reduction in energy use with the solar water heating system and compares well with the June and July reductions of 63% and 60%, respectively. Consistent findings indicate that the tank and piping insulation has reduced the standby tank losses and improved the solar water system efficiency.
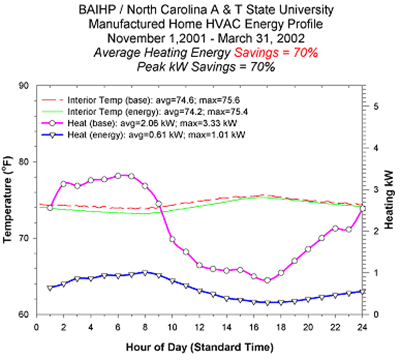
Figure 76. Heating season consumption and
savings
for
side by side study of Energy Star Manufactured Housing.
Year 3 Side-by-Side Monitoring Results:
Heating system savings (2001 to 2002) were a remarkable 70% during Phase 1. Cooling energy season savings were 36%, less than heating but still very substantial. The combined heating, cooling, and water heating savings were 52% for a 9-month period. (Figure 76)
In addition to the energy monitoring effort, NCA&TSU researchers investigated the feasibility of replacing the conventional framing/envelope used in manufactured/industrial housing with alternative systems. Included in this evaluation, was an analysis of the energy impact of using aerated autoclaved concrete (AAC) flooring systems and structural insulated panels (SIP) to supplant traditional wall and roofing systems. The economic viability of using AAC blocks for structural skirting/foundation around the model units also was evaluated.
Analysis’ results determined:
Portland, OR; Boise, ID; Marysville, WA
Project Overview
This was primarily a WSU (with subcontractors Oregon and Idaho) and Pacific Northwest National Lab (PNNL) task. Other partners included FSEC, UCFIE, the State Energy Offices of Oregon and Idaho, school districts in Portland, Oregon, in Boise, Idaho and Marysville, Washington, regional utilities, manufacturers, and other stakeholders in the Pacific Northwest.
The objective of this task is to promote the adoption of energy efficient portable classrooms in the Pacific Northwest that provide an enhanced learning environment, high indoor air quality, and both substantial and cost-effective energy savings. BAIHP staff focus on four main goals: (1) offering technical assistance to portable classroom manufacturers, school districts, and related organizations, (2) field assessment, monitoring, and analysis of innovative building technologies and energy saving features to determine their value, (3) facilitation of collaborative agreements among regional utilities, northwestern portable classroom manufacturers and materials and equipment suppliers, as well as school districts, and state education departments and their affiliates, and (4) conducting and creating educational opportunities to advance the widespread adoption of energy efficient portable classrooms in school districts nationwide.
The experiences working on the energy efficient portable were instructive, particularly in the identification of flaws in portable classroom design. The difficulties that BAIHP staff encountered demonstrate the importance of well-defined commissioning protocols, documentation, and coordination among all personnel that service and install HVAC equipment.
Findings:
Based on data analysis from years one through four, the following measures were recommended.
Recommendations:
School Partnerships
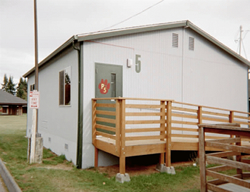 |
Figure 77. 64 Energy
efficient portable classroom at Pinewood Elementary School in Marysville,
Washington |
Washington Schools - Pinewood Elementary
An 895 ft2 portable classroom (P5) was sited at the Pinewood Elementary School in Marysville, Washington in August 2000. This unit exceeded current Washington State Energy Code standards with upgraded insulation in the floor, roof and walls, low-E windows, and a sensor-driven ventilation system that detects volatile organic compounds (VOCs). A second portable, built in 1985, and also located at Pinewood Elementary (P2), served as the control unit. (Figure 77)
Energy use comparisons of the two classrooms show that the energy efficient portable used considerably more energy than the control portable. This was attributable to several factors:
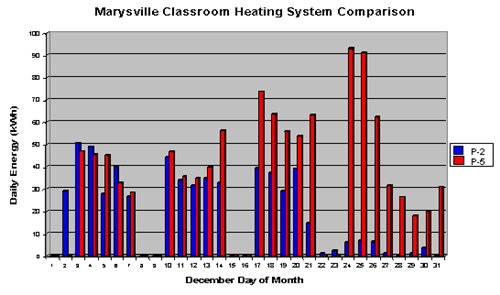
Figure 78. Graph comparing heating system use
of the Pinewood control portable (P2-Blue)
with the energy efficient portable
(P5-Red). Note the energy efficient portable’s high energy
use during
the Christmas holidays due to incorrectly configured heating system controls.
BAIHP staff proposed the following recommendations to Pinewood Elementary:
Based on the above recommendations, WSU researchers worked with Marysville school facility manager and customer representatives from Snohomish Public Utility District to assist them in setting new construction specifications for 13 portable classrooms they will procure during the next reporting period. Marysville School District will specify a completely sealed ceiling barrier, a new model heating/ventilation system, a 365 day programmable thermostat, window placement on opposite sides of the classroom, and exhaust fan placement on an opposite wall from the fresh air supply.
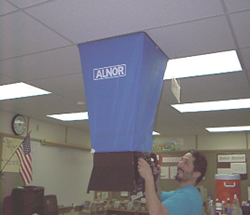 |
Figure 79. Ventilation system testing
at North Thurston School District. |
Washington Schools - North Thurston School District
BAIHP staff also worked with the North Thurston School District to troubleshoot a portable classroom in Lacey, Washington. (Figure 79) The classroom was experiencing high energy use and poor indoor air quality. BAIHP staff tested the classroom, made recommendations including opening the supply dampers, installing a wall side vent to better ventilate the classroom and discussed the specification development process with district staff. The North Thurston School District now is including most of the measures listed in the new procurement guidelines for their future portable classroom purchases. The school district will investigate the feasibility of installing an air/vapor above the T-bar dropped ceiling and will record costs for making these improvements.
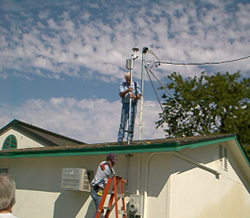 |
Figure 80. Weather monitoring system installation in the Boise portable classroom. |
Idaho Schools - Boise School District Retrofit
BAIHP staff located a portable classroom at the West Boise Junior High School in the Boise Idaho School District, occupied by a teacher who was interested in having the classroom monitored and retrofitted. The teacher also is an Idaho State legislator active in education issues, which staff members believe will increase the chances of implementing the final recommendations. (Figure 80)
BAIHP staff performed a baseline audit, and installed monitoring equipment to track the classroom’s energy use during 2000. In 2001, the classroom was retrofitted with an efficient HVAC system (controlled by CO2 sensors), lighting, and envelope measures. The classroom was then reaudited, and monitored for the remainder of the year.
BAIHP staff worked with Pacific Northwest National Laboratories (PNNL) on the pre- and post-retrofit audits, and installation of the monitoring equipment. In their capacity of providing energy management services to the school district, the local utility Avista Corporation, collected lighting and occupancy data.
Monitoring data indicates a 58% reduction in energy usage post-retrofit. Blower door tests indicate a reduction in air leakage from nine ACH at 50 Pa to five ACH at 50 Pa. Data also revealed that heating use actually increased on weekends and holidays because of lack of internal heat gain and because the HVAC control systems are not programmed to shut off on weekends and holidays. The total retrofit cost was $9,892.
Monitored data suggests that the CO2 sensor that controls the HVAC system is not correctly configured. The system does seem to react to an increase in CO2 levels early in the day, but does not remain on; CO2 levels only begin to significantly dissipate after one o'clock PM. BAIHP researchers have noted the difficulty of correctly configuring these sensors in other monitored classrooms.
Oregon Schools
Oregon BAIHP staff worked with the Portland Public School District to procure two energy efficient classrooms. These were constructed to BAIHP staff specifications and included increased insulation, high efficiency windows, transom windows for increased daylighting, a high efficiency heat pump, and efficient lighting. Staff videotaped the construction of one classroom.
Monitoring equipment was installed by PNNL staff. Estimates using the software Energy-10 indicated a total energy consumption of 9200 kWh, or $583 per year at Portland energy rates. Measured results showed the Oregon portable used about 6600 kWh for the monitored period.
Incremental costs for the energy efficiency measures were $6,705 over Oregon commercial code, including approximately $2,500 for the HVAC system. This suggests a simple payback of 10 to12 years.
Initial blower door tests found air leakage rates of 11.3 ACH at 50 Pa. BAIHP staff also identified significant leakage through the T-bar dropped ceiling and up through the ridge vents. Other monitoring results indicated that the same HVAC control problems exist with the Oregon classroom as with the others studied in this project.
The Energy Efficient model outperformed code level models in the Portland area. The older the classroom, the more energy consumed. Even when compared with new code level models from the same year, the Energy Efficient model used 35% less energy. Conventional code level classrooms do not include energy efficient measures which greatly increases the unit’s operating costs. Classrooms built more than 10 years ago, use twice as much energy as the efficient model. Those older than 20 years consume more than three times the amount of energy. From this study, researches determined that high performance classrooms can save anywhere from $200 to $1000 dollars a year in energy costs compared to older, less efficient portables.
A survey sent to teachers and maintenance staff indicates a high degree of satisfaction with the efficient portables; the teachers were most impressed with the improved indoor air quality and increased light levels due to the daylighting windows.
Historical Data Collection
In Idaho, Oregon, and Washington, BAIHP staff worked with local utilities and school districts to obtain historic energy use data on portable classrooms. This data will be used to compare energy usage from the energy efficient portables monitored in this study.
In Idaho, BAIHP staff worked with Avista Corporation's energy manager to collect historic data on 14 portable classrooms in the Boise School District. The classrooms each were equipped with discrete energy meters; as a result, BAIHP staff was able to obtain energy usage data for the past three to four years. A procedure was developed to collect information on portables at each school in cooperation with the physical facilities manager and each school lead.
Paper: McIlvaine, Janet, David Beal, Neil Moyer, Dave Chasar, Subrato Chandra. Achieving Airtight Ducts in Manufactured Housing. Report No. FSEC-CR-1323-03.
Over the past 10 years, researchers at FSEC have worked with the Manufactured Housing industry under the auspices of the U.S. Department of Energy (DOE) funded Energy Efficient Industrialized Housing Program and the Building America (BA) Program (www.buildingamerica.gov). FSEC serves as the prime contractor for DOE’s fifth Building America Team: the Building America Industrialized Housing Partnership (BAIHP) which can be found online at: www.baihp.org.
Data and findings presented here were gathered between 1996 and 2003 during 39 factory visits at 24 factories of six HUD Code home manufacturers interested in improving the energy efficiency their homes. Factory observations typically showed that building a tighter duct system was the most cost effective way to improve the product’s energy efficiency.
BAIHP and others recommend keeping duct system leakage to the outside (CFM25out) equal to or less than 3% of the conditioned floor area, termed Qnout. However, most homes seen in a factory setting cannot be sealed well enough to perform a CFM25out test. Results of many field tests suggest that CFM25out will be roughly 50% of total leakage (CFM25total). Thus, to achieve a Qnout of less than 3%, manufacturers should strive for a CFM25total of less than 6% of the conditioned area (Qntotal).
Researchers measured total duct leakage and/or duct leakage to the outside in 101 houses representing 190 floors (single wide equals one floor, double wide equals two floors, etc.). Ducts systems observed in these tests were installed either in the attic (ceiling systems) or in the belly (floor systems). Researchers tested 132 floors with mastic sealed duct systems and 58 floors with taped duct systems.
Of the 190 floors tested by BAIHP, the results break down thus:
For mastic sealed systems (n=132):
For taped systems (n=58)
The results show that, while it is possible to achieve the BAIHP Qn goals by using tape to seal duct work, it is far easier to meet the goal using mastic. What isn’t illustrated by the results is the longevity of a mastic sealed system. The adhesive in tape can’t stand up to the surface temperature differences and changes or the material movement at the joints and often fails. Mastic provides a much more durable seal.
Typical factory visits consist of meeting with key personnel at the factory, factory observations, and air tightness testing of duct systems and house shells. A comprehensive trip report is generated reporting observations and test results, and pointing out opportunities for improvement. This is shared with factory personnel, both corporate and locally. Often, a factory is revisited to verify results or assist in the implementation of the recommendations.
The most commonly encountered challenges observed in the factories include:
Duct system recommendations discussed in this report include:
Summary of BAIHP Approach to Achieving Tight Ducts in Manufactured Housing:
Finally, duct tightness goals can be achieved with minimal added cost. Reported costs range from $4 to $8. These costs include in-plant quality control procedures critical to meeting duct tightness goals.
Achieving duct tightness goals provides benefits to multiple stakeholders. Improving duct tightness diminishes uncontrolled air (and moisture) flow, including infiltration of outside air, loss of conditioned air from supply ducts, and introduction of outside air into the mechanical system. Uncontrolled air flow is an invisible and damaging force that can affect the durability of houses, efficiency and life of mechanical equipment, and sometimes occupant health. With improved duct tightness, manufacturers enjoy reduced service claims and higher customer satisfaction, while homeowners pay lower utility bills, breathe cleaner air, and have reduced home maintenance.
Crawl
Space Moisture Research for HUD Code Homes
Research led by David Beal
Paper: Beal, D. and Chasar, D. (2006). "Measured
Crawlspace Conditions in a HUD-code Home", Fifteenth
Symposium on Improving Building Systems in Hot and Humid Climates, July 24-26, 2006
Orlando, FL
Article: Manufactured Home Merchandiser. “Measured
Conditions in a MH Crawl Space” June 2005.
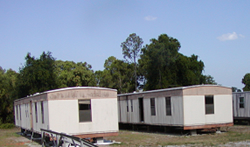 |
Figure 81. The test units in place.
Note white ground cover under unit on left, exposed dirt under unit on
right. |
When BAIHP started to respond to HUD code manufactures’ floor damage complaints, the diagnosis often pointed to air distribution system leaks which created negative pressure in the house pulling hot, humid, outside air into air conditioned spaces and unconditioned interstitial spaces such as wall and floor cavities.
In some cases this led to condensation and rot. From this research and the resultant recommendations, HUD Code Home manufactures have learned to prevent such occurrences and have dramatically improved distribution system air tightness practically eliminating such problems For background on this matter, see these sections of this report:
Successfully sealing HUD code home crawlspaces may be the last piece of the solution for preventing floor failures plaguing homes in hot, humid climates. Merely curing the duct leakage has proven not to enough to keep all floors intact. Proper techniques to seal these crawlspaces need to be developed. The research reported here and BAIHP’s research plan for 2005 addresses this need.
Field Experience
BAIHP researchers have observed that some houses with rotting floors have acceptably tight ductwork, suggesting that factors other than distribution system dynamics are influencing moisture flow. The rot manifests primarily under vinyl flooring which acts a vapor barrier between the conditioned space and floor substrate, which suggests an external source of moisture. BAIHP researchers further observed that the crawlspaces in these homes are damp and musty, often showing signs of standing or running water in the crawlspace.
FSEC concluded that the only uncontrolled moisture source is the humid air in the crawl space of the home driven by vapor pressure toward the cool conditioned space. Several manufacturers address this potential moisture source by requiring a vapor retarder to be placed over the dirt in the crawl space prior to the installation of the house. However, a further exacerbation of the problem stems from the current trend toward extending the siding of the house all the way down to the grade level, in place of the traditional vented skirting. This tends to reduce ventilation, the primary mechanism for dissipating moisture leaching from the ground into the crawls
Other researchers (www.crawlspaces.org) have reported on sealed crawl spaces, and recommended them as a solution to the crawl space moisture problem. The findings from those studies indicate that merely covering the ground without truly sealing the crawl space is not sufficient to solve the problem of high crawl space humidity. The joints and penetrations in the crawl space must be seal to prevent air infiltration as well.
Summer 2004 Research
To determine if a sealed crawl space solution could be achieved in HUD Code Homes, research needed to be done to address the unique building techniques in that industry, namely the use of vinyl skirting to enclose the crawl space. To that end, in 2004, BAIHP conducted research utilizing two single-wide manufactured houses at FSEC’s auxiliary test site in Cocoa, FL..
The crawl space research plan involved two unconditioned, singlewide manufactured homes sited side-by-side, one home with a ground cover under it, the other without a ground cover (only exposed dirt.). A third identical home was available; however, it was not called into use in this experiment. In each of the two experiment houses, three different skirting (crawl space enclosure) options were evaluated: open or no skirting, perforated skirting, and solid skirting. The solid skirting mimics the effect achieved by extending siding down to the ground instead of stopping it at the band joist, described above. Additional evaluations were planned, however, the Florida’s four hurricanes dramatically curtailed the testing schedule.
The homes (all three) were instrumented with temperature and humidity sensors,
two in the crawl space and one in the interior. The site has a weather station,
recording ambient conditions. The temperature and relative humidity was used
to calculate the dewpoint at the measurement location.
Data Analysis, Interpretation, and Conclusions
The presented data is the ambient dewpoint, the dewpoint of the two crawl spaces. The ambient readings are subtracted from the average of the two crawl space readings to show the temperature difference or )T. The final column of the Table 59 (“Difference”) is the difference between the ground cover and the non-ground cover crawl space, showing how much dryer a crawl space with a ground cover is; negative numbers indicating that the ground covered crawl space was dryer.
Table 59. Dewpoint Temperatures
Ambient Dewpoint |
Dewpoint with Ground Cover |
)T Tamb-Tcwl |
Dewpoint with No Ground Cover |
)T Tamb-Tcwl |
Difference |
|
No Skirting 06/09 – 07/08 |
73.30F |
73.30F |
0.00F |
73.30F |
0.00F |
0.00F |
Perforated Skirting 07/18 – 07/30 |
73.50F |
73.70F |
0.20F |
75.40F |
1.90F |
-1.70F |
Solid Skirting 08/23 – 09/03 |
74.30F |
76.30F |
2.00F |
78.60F |
4.30F |
-2.30F |
This data clearly illustrate a potential problem for manufactured houses, or any home on a crawl space. As can be seen, the average crawlspace dewpoint with skirting and no ground cover was over 750F. Both crawlspaces with solid skirting were above 760F. Any surface in the crawl space that is at or below the dewpoint will condense moisture. Surfaces that could be problematic are exposed floors, A/C ductwork, and plumbing. Also, note that these numbers are averages gathered over at least one week of measurements. The maximums are much higher in all cases, but of a short duration.
The research shows that if a ground cover and perforated skirting are used, the dewpoint in the crawl space will stay near the ambient dewpoint, on average. Often, this is sufficient to avoid problems in homes with crawl spaces. However, if overly cool conditions are maintained in the house (interior temperatures below the ambient dewpoint), problems can still occur.
Research (www.crawlspaces.org) into site built housing with block stem walls has shown that unvented crawlspaces with a ground cover are significantly dryer than vented crawlspaces if they start out as a dry crawlspace or provisions were made to dry them out after completion, such as a dehumidifier or supply air provided to the space. However, the BAIHP data from the “solid skirting and a ground cover” condition do not support this conclusion.
The conclusion is that the solid skirting did not create an adequate seal of the crawl space, allowing significant moisture into the crawlspace. Suspected entry paths for the moisture intrusion were along the joint behind the skirting starter strip, as well as under the molding used to hold the skirting in place at the ground.
HUD code homes (and older site built homes) placed on piers and skirted pose unique challenges to executing the sealed crawl spaces detail. To overcome the air infiltration points associated with skirting described above (at the top and bottom of the skirting) a continuous vapor barrier is needed from the band joist down to and covering the ground. This however would interfere with visual inspect for termite mud tunnels, possibly voiding the termite protection company’s bond. The problem is overcome in crawlspaces with a block walls by stopping the vapor barrier a few inches below the band joist, to allow for inspection.
Summer 2005 Crawlspace Research
In the final year of the project, to further research into finding a successful way to seal the crawlspaces of HUD code housing, BAIHP installed a vapor retarder in our on-site, well instrumented, manufactured housing laboratory (MHLab).
The experiment was designed to investigate ways to allow for insect inspection, as well as sealing around penetrations such as piers, anchors, plumbing, and A/C duct work (to package units). The research also addressed ways to dry the crawlspace, both from ambient moisture and potential flood problems.
Air tightness testing of the “sealed” crawl space showed that although the crawl space is much tighter than that provided by solid skirting, it was still too leaky. The crawlspace was more tightly sealed in June 2005. A dehumidifier was installed in “Cleanspace” sealed crawlspace in MHLab with a runtime logger to reduce high RH levels, and a fan to blow 50cfm from main body into crawlspace.
Researchers conducted a series of MHLab crawlspace tests. A sealed crawlspace was conditioned using five different strategies.
This BAIHP research was been accepted by the trade journal “Manufactured Home Merchandiser” in an effort to get the information to the people in the manufactured home industry that can alter installation requirements
Paper: Thomas-Rees, Stephanie, Chandra, S., Barkaszi, S., Chasar, D., and Colon, Carlos (2006). “Improved
Specifications For Federally Procured Ruggedized Manufactured Homes For Disaster Relief in Hot/Humid Climates," Fifteenth Symposium on Improving Building Systems in Hot and Humid Climates, July 24-26, 2006 Orlando, FL.
In response to hurricane Katrina in September 2005, BAIHP researchers conducted a literature review and provided information to DOE and others on energy consumption of manufactured and site built homes in the region and desirable characteristics of FEMA manufactured homes. In response, DOE has provided additional funding to develop detailed specifications for FEMA manufactured homes that will offer superior performance. Researchers conducted a simulation comparison of FEMA single-wide houses with comparable Therma-Save (SIP) panel homes and furnished information to DOE, FAS and others.
Subsequently, BAIHP received supplemental funding to develop recommended specifications for federally procured ruggedized manufactured homes that the Federal Emergency Management Agency (FEMA) uses to provide short term housing solutions during the repair and rebuilding phase after a natural disaster.
Federally procured manufactured homes are currently constructed in accordance with the Housing and Urban Development’s (HUD) manufactured housing standards and typically built to the minimum code requirements. These homes can consume more energy than their site built comparatives and use materials and mechanical systems that can potentially contribute to poor indoor quality and low durability. Two improved specifications are presented in this report to enhance energy efficiency, sustainability, and indoor air quality and provide back up power, without compromising human health, safety or comfort, in typical ruggedized temporary housing.
Starting with the specifications from the base case or typically procured ruggedized home, two specifications were developed, the EnergyStar (ES) and the Building America Structural Insulated Panel (BASIP) manufactured home. These were evaluated using the FSEC developed EnergyGauge® USA (Version 2.5.9) software which, predicts building energy consumption. The ES home saved 14% in energy costs over the base case, which amounts to savings of $25.9 million during the first year of existence ($4.5 million in energy savings and $21.4 million in construction costs) when procuring 25,000 ruggedized manufactured homes for temporary use. The BASIP home, which has a roof integrated, 3.25 kWp photovoltaic (pv) array, projects energy savings of 78% or $25.4 million over the base case. The BASIP without the pv array would be about 38% more energy efficient than the base case (analysis based on units located in New Orleans, LA and utility rates of $0.13/ kWh). The annual equivalent life cycle costs for the base case and the two alternatives were calculated to be $5,413 per year, $3,670 per year and $3,649 per year for the base, ES and BASIP respectively.
Analysis considered not only tangible benefits such as having back up power capability for essential loads during extended power outages but also intangible benefits like more daylit spaces and potential mating of two units. This report also generated areas for further investigation of innovative technologies and construction methods.
The improved specification presented by this work will allow for better quality control of construction and also include renewable energy strategies that encourage occupants to take ownership if the situation warrants. The inclusion of renewable energy would create a self-powered strategy that would provide power for essential functions during power outages and interferences associated with neighborhood reconstruction following a natural disaster.
The Comboflair HVAC unit is a combination domestic water heater and hydronic coil heating unit produced by Delima Associates. It needs only half the space of a stand alone gas furnace and water heater, and is more cost effective than electric heating and water heating. Designed specifically for the HUD-code home market, it is installed during production and eliminates the need for mechanical contractor during the set up process at the home site. Palm Harbor Homes has installed the Comboflair unit in several manufactured homes with Unico’s small-duct high-velocity (SDHV) air distribution system.
During the final year of the project, FSEC researchers discussed testing requirements for the Comboflair system Delima and Unico and developed a non-disclosure agreement. They also tested a PHH home in Austin, TX and used a datalogger to collect interior living conditions throughout the home as well as detailed measurements of the Comboflair’s thermal and electrical performance. Analysis of the data began. Researchers redesigned the water injection system to provide a less problematic delivery of interior water vapor.
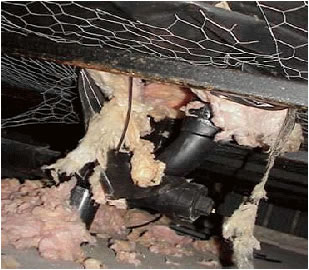
BAIHP Home | Overview | Case Studies | Current Data
Partners | Presentations | Publications | Researchers | Contact Us
Copyright © 2002 Florida Solar Energy Center. All Rights Reserved.
Please address questions and comments regarding this web page to BAIHP Master