| Abstract
Two
nearly identical houses situated next to each other in Bossier
City, Louisiana were studied in an effort to better understand
moisture and cooling energy related problems in manufactured
houses with low thermostat set-points during the cooling season.
By design, the major difference between houses was the type
of air conditioning units. House A had a standard split air
conditioner and House B had a two-speed split air conditioner.
In
an effort to make the buildings more similar, the building
airtightness was adjusted until it was the same in each house,
and duct leaks were sealed so that the ducts were tight and
there was equal tightness in both houses. A ventilation system
was also added at the same time of duct repair. Duct repair
and the ventilation modifications resulted in significant
impacts on the cooling energy, temperature, relative humidity,
and building pressures. Cooling energy decreased 37% in House
A and 18% in House B, while the floor space dewpoint increased
significantly. It is estimated that 35 % savings was due solely
to duct repair in House A and 17% in House B. The primary
cause of House A savings being twice House B is attributed
to House A operating at nearly twice the capacity most of
the time and had more duct leakage repaired. This resulted
in higher system pressures and therefore greater duct leakage
than in House B. Before building modifications, House A used
15.4 kWh per day (32%) more than House B and 3.4 kWh per day
(11%) more after modifications.
A
method of characterizing interstitial spaces using dewpoint
measurement is presented and shows that the belly space became
2.6 times more like outdoor conditions after repairs in House
A and 2.0 times more in House B.
Background
Moisture
damage has been observed in a significant number of new manufactured
houses located in the hot and humid southeast (Moyer et. al.
2001). FSEC has been involved in investigations of moisture
damage in over 25 manufactured homes built by various companies
from 1999 to 2000. Some floors were found to be buckling under
vinyl sections of finished floors. Other problems encountered
were soft wallboards, damaged wood molding and mold growth.
Objectives
The
purpose of monitoring was to examine how different cooling
equipment and building modifications would impact energy usage,
temperatures and relative humidity in various zones or cavities.
This
paper will discuss a seasonal monitoring effort that was designed
to study temperature, humidity and energy used in a typical
manufactured house model with a very low thermostat set-point.
House
Characteristics
Each
manufactured house was unoccupied, had no skirt around its
bottom and was located on an asphalt lot. The general floor
plan was 1311 square feet (122 m2) of living area
with three bedrooms, 2 baths and utility room. Exterior finishing
was vinyl siding and interior floors had carpet with vinyl
floor in kitchen and utility areas. Both houses were identical
with the following exceptions. House B had a living space
that was 6 inches (15.2 cm) higher than House A. House B also
had a two-speed split DX cooling system where House A had
a standard issue single speed split DX cooling system. Both
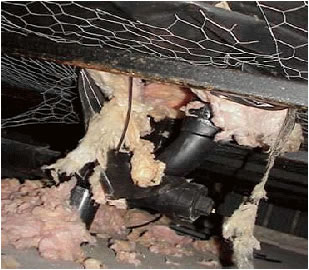
houses had electric strip heat. Air handlers were located
in the utility room closet space and supply ducts were located
in the belly space with floor mounted air registers. A belly
space is a volume directly under the floor that is separated
from the crawlspace by a vapor barrier, however, penetrations
such as plumbing, and rips often compromise the barrier's
effectiveness. Since there were no occupants, ventilation
was controlled using exhaust fans on timers. This was done
to simulate typical occupancy induced ventilation. The refrigerant
charge of both cooling systems was checked before monitoring
began.
Monitoring
Description
Each
house was instrumented with a datalogger and several sensors
and meters August 10-12, 2000. About 42 channels of data were
sampled at least every 10 seconds and stored at 15 minute
intervals. Experiments were conducted from August 13- October
23, 2000. Duct tightness and ventilation modifications happened
during September 6-8, when duct leaks were repaired, and a
ducted ventilation system was installed in both houses. This
ventilation system brings outdoor air into the return side
of the air handler before the cooling coil and distributes
it throughout the house whenever the unit is on. The exhaust
fan controlled ventilation was decreased at this time. Since
there was no return duct, only supply leaks were repaired.
Performance
Test Results
Building
and duct airtightness, airflow and pressures were measured
at different stages in the monitoring project. Since comparisons
were to be made between both houses, it was desired for them
to have similar building and duct airtightness. House A envelope
was tightened and House B was made less tight such that both
houses had a very similar amount of envelope leakage. The
resulting tightness was about 9.5 ACH50. This means 9.5 building
air volumes would be exchanged in one hour while the building
is depressurized to 50 Pascals.
Table
1 shows duct airtightness and air distribution flow measurement
results. CFM25out is a measurement of the accumulated hole
size in the duct system. It is the amount of airflow in cubic
feet per minute that leaks into the duct from outside when
it is depressurized 25 Pascals. The system airflow is in cubic
feet per minute (cfm).
Table
1. Duct Airtightness and distribution system flow rate before
and after repairs.
| House
|
Pre
CFM25out |
Post
CFM25out |
Pre
airflow |
Post
airflow |
| A
|
167
|
31
|
1248
|
1355
|
| B
|
114
|
23
|
1271
|
1421
|
Impact
of Duct Repair and Ventilation Modifications
The
goal of duct repair was to seal as much of the leakage as
possible and still have a similar amount between the two houses.
House A duct leakage was reduced 136 CFM25 (an 81% reduction)
and House B duct leakage was reduced by 91 CFM25 (an 80% reduction).
Repairing duct leaks had a significant impact on the airflow,
cooling energy, and temperature and relative humidity of both
houses. The ventilation was modified the same time as duct
repair to evaluate a positive system ventilation technique.
It would have been better to evaluate this separate from the
duct repair for analysis purposes, however, the amount of
available summer weather for monitoring was limited at this
time so it was decided to do it at the same time.
Air
Distribution Flow
The
distribution system airflow in House A increased by 107 cfm,
and by 150 cfm in House B as indicated in the last two columns
of Table 1. The airflow of the added ventilation system was
about 20 cfm.
Cooling
Energy
There
was also a significant impact on cooling energy from duct
repair and ventilation modifications. Large reductions in
cooling energy were observed. Cooling energy savings were
analyzed in the following way. First the daily average indoor
and outdoor temperatures were calculated from data stored
at 15 minute intervals. Then the difference was calculated
by subtracting the daily average indoor temperature from the
outdoor temperature. Next the air conditioner fan and compressor
energy were totaled for each day. A least squares linear regression
analysis was performed using energy versus delta temperature
(dT). This established a linear equation that best predicts
cooling energy use for a given monitoring period at different
dT. In this analysis the strength of the correlation of energy
versus dT is described by the coefficient of determination,
known as R2. R2 is a number that can
be from 0 to 1 where 0 indicates no correlation between variables
and 1 indicates an excellent correlation.
Figure
1 shows measured data and best-fit lines for House A (R2
before repair was 0.83 and 0.92 after.) Using a typical summer
average outdoor temperature of 83 F (28.3 C) and the indoor
monitored temperature of 71 F (21.7C), the dT would be 12
F. Calculating the energy used before and after duct repair
with a dT of 12 F results in a pre-repair daily energy use
of 47.66 kWh and a post-repair daily energy use of 29.78 kWh.
Therefore, duct repair with the ventilation system operating
and bath exhaust schedule off results in a daily reduction
of 17.88 kWh (37.5% savings).
Figure
1 House A Cooling Energy vs. dT.
Following
the same calculation procedure as House A with a 12 F dT for
House B, results in a pre-repair daily energy use of 32.24
kWh and a post-repair daily energy use of 26.42 kWh. (R2
before repair was 0.75 and 0.92 after.) Therefore, duct repair
with the ventilation system operating results in a daily reduction
of 5.82 kWh (18.1% savings).
Figure
2 House B Cooling Energy vs. dT.
Duct
Pressure, Leak Size, and Location Affect Cooling Energy Losses.
Sealing
136 CFM25 of the leakage in House A resulted in 37% savings
and sealing 91 CFM25 of the leakage in House B resulted in
18% savings. It is important, however, to keep in mind that
it is not only how much leakage (CFM25) that is repaired that
will determine energy savings, but also where the leaks are
located. Consider two holes of equal size at different duct
locations where the duct pressure is much greater at one location.
The hole at the higher pressure location, such as near the
air handler, will have a greater amount of duct leakage under
operating conditions than a hole near a supply register where
the pressure may be ten times lower. Hole location also impacts
the severity of energy penalty, which is affected by the energy
of the air that is transferred from duct leakage. A return
leak from between the floor and belly barrier would have less
impact than the same leak that pulled air from a vented attic
space.
Cooling
Energy Savings Estimate for Duct Repair Only.
Duct
repair occurred the same time as modifications to ventilation.
A bathroom fan was scheduled using a timing device and operated
from 6AM-9AM and also from 4PM-10PM during the monitoring
period prior to duct repair, however when duct repairs
were made, the ventilation system was installed and bathroom
exhaust was turned off. This resulted in a change in the indoor
ventilation rate, which would have impacted the cooling load.
Since the duct repair was not monitored as a separate change,
the monitored cooling energy use cannot solely determine the
impact from duct repair. However, estimates are made here
to suggest what the savings may be in both houses from only
duct repair.
The
monitored indoor and outdoor temperatures and relative humidity
during the experiments were used to determine the average
enthalpy using a psychometric chart. The average enthalpy
only reflects periods when fans were in operation. Based on
airflow of the ventilation and bathroom exhausts and the change
in enthalpy, the ventilation cooling load was calculated.
The typical run-time of the air distribution system was identified
for the seven warmest days during the monitoring and the enthalpy
was weighted for time of day when the a/c was on.
After
adjustments were made to the impact of ventilation changes,
House A saved 16.67 kWh / day (35%) and House B saved 5.47
kWh / day (17.0%) from duct repair.
Energy
Comparison Among Houses.
When
the two-speed system operates at full capacity, it uses the
same amount of power as the standard system, however the two-speed
system rarely operated at peak capacity. Based on monitored
data, the two-speed system used almost 12% less daily cooling
energy on a typical summer day than the standard system. The
primary reason is due to less duct leakage when the two-speed
system operates at half of total capacity. This results in
lower duct pressures than in House A and therefore less total
duct leakage.
Moisture
Removal Comparison Among Houses.
For
days when the outdoor dewpoint was > 60 F (15.6C), the average
of several daily condensate totals shows that the two-speed
system (House B) removed about 20% more latent heat (condensate)
than the standard system. This can be explained by the longer
run-time fraction of the two-speed system which ran about
32% more per day during the 7 hottest days of the post duct
repair monitoring period. Overall, both systems removed moisture
well, which resulted in average indoor conditions shown later
in Tables 3 and 4. Indoor relative humidity around 50% is
not surprising due to very low thermostat set-points.
Cooling
Power
The
limited amount of data and cooler temperatures during the
post duct repair period made it difficult to find more than
one pre and post day that had very similar outdoor conditions.
September 7 and 16 were similar days with average outdoor
temperature of 80 F (26.7C) (each day), relative humidity
of about 50%, and daily solar energy of 5415 Whr pre repair
and 5411 Whr post. The days used for comparison do not represent
a design day, as there were not any such days available after
repair. The comparisons shown in Figures 3 and 4 best reflect
the cooling demand during an average summer day.
Figures
3 and 4 show the daily profile of measured power usage before
and after modifications. Table 2 shows the average cooling
demand during the peak utility period from 3PM - 6PM before
and after.
Figure
3 House A Cooling Demand
Figure
4 House B Cooling Demand
Table
2. Coincident Peak Demand of Cooling Power from 3pm-6pm
| House
|
Pre
kW |
Post
kW |
Delta
kW |
%
Diff. |
| A
|
3.464
|
2.443
|
1.021
|
29.5
|
| B
|
2.332
|
1.582
|
0.750
|
32.2
|
Impacts
on Building Zone Conditions
The
most notable impacts that duct repair and the positive ventilation
system had on building conditions were on the building pressures
and the dewpoint of the belly space. Interior pressures changed
from negative to positive with reference to
(wrt) outside, and the belly conditions became less dry. There
are also indications that the attic space became drier. Three
days before repair were compared to three days after repair.
Outdoor crawlspace dewpoint and solar insolation were used
as criteria for establishing similar days before and after
repairs. Changes in building environment are first discussed
for House A then House B in the paragraphs that follow. Tables
3 and 4 show three-day period averages of drybulb and dewpoint
temperatures and relative humidity at various locations for
House A and B respectively.
Zonal
Conditions House A
Table
3. Three-day period averages at House A before and after duct
repair.
| |
in
db F
(C) |
in
RH % |
in
dew F
(C) |
attic
db F
(C) |
attic
RH% |
attic
dew F
(C) |
crawl
db F
(C) |
crawl
RH% |
crawl
dew F
(C) |
belly
db F
(C) |
belly
RH % |
belly
dew F
(C) |
| Pre
|
70.8
(21.6) |
51.4
|
52.1
(11.2) |
104.5
(40.3) |
39.5
|
74.9
(23.8) |
83.1
(28.4) |
61.8
|
68.5
(14.7) |
71.3
(21.8) |
59.8
|
56.6
(13.7) |
| Post
|
70.6
(21.4) |
51.8
|
50.9
(10.5) |
89.3
(31.8) |
49.4
|
67.8
(19.9) |
78.9
(26.1) |
70.3
|
68.4
(14.7) |
71.1
(21.7) |
75.5
|
63.0
(17.2) |
House
A Interior.
Interior
temperature and relative humidity remained nearly constant.
Even the inside of exterior wall temperature and relative
humidity conditions remained nearly the same after repair.
The wall conditions were dry with dewpoints only 2 to 4 F
higher than the conditions at the thermostat.
House
A Pressure.
The
house main body pressure changed by 0.7 pa from -0.4 pa wrt
outside to +0.34 pa. The main wall pressure sensor malfunctioned
during the pre repair period, but the master bedroom wall
pressure changed 0.56 pa from +0.46 pa wrt indoor to -0.10
pa.
House
A Belly Space.
The
belly dewpoint increased by 6.4 F (11.3%). This is likely
due to the loss of cool dry air from duct leakage. The impact
of duct leakage in the belly space may help explain why some
houses have had moisture problems while other identical models
have not.
Unconditioned
Zone Diagnostic.
Evaluating the nature of interstitial spaces can be difficult
and determining the potential for building degradation or
other problems can be even more difficult. Pressure measurements
taken of interstitial spaces can locate primary air barriers
and indicate the potential nature of a space when a calibrated
blower door fan is used to depressurize a conditioned space.
This test, however, does not characterize the space under
real operating conditions and can not evaluate the performance
of a vapor barrier. A simple method of determining whether
a space is more like indoors than outdoors (during specific
conditions) is presented here and can be considered useful
to evaluate air, thermal, and vapor barriers in a specific
construction through characterizing the space. The usefulness
is limited to buildings where there is a reasonable difference
between indoor and outdoor dewpoint and the interior has been
conditioned (heated or cooled) several hours.
A
temperature difference of at least 10 F is preferable, and
the greater the out - in difference, the more reliable the
characterization can be. Once the dewpoint temperature in
the interstitial space and the dewpoint indoors and outdoors
is known, the space can be characterized in a relative manner
using the equation below, where T is the dewpoint temperature
and OA% is the percentage of outside air mixture in the zone.
Zone
T - In T x 100% = OA %
Out T - In T
A
space with 90% similarity to outdoors can be considered outside
the conditioned space, but is influenced by the conditioned
space in some way. A space that is 50% is not dominated by
either side.
Consider
the measurements of House A before repair shown in Table 3.
The outdoor - indoor dewpoint difference is 16.4 F, and belly
space - indoor difference is 4.5 F.
The
similarity to outdoors before duct repair is calculated as
shown below:
4.5
/ 16.4 x 100% = 27.4%
Before
repair, the belly space dewpoint was about 27 % similar to
the outdoor dewpoint, but after repair, it was about 70 %
similar to the outside as illustrated in Figure 5. This means
that the outdoor similarity increased 2.6 times more like
outdoors after repair.
Figure
5 Belly Space Characterizations Before and After Repairs
It
became more like the outdoor conditions even though the indoor
pressure was positive wrt outside. Positive pressure would
cause indoor air to be pushed into the belly space wherever
pathways exist. Based on the belly conditions, the interior
floor is more airtight than the belly barrier. Since the temperature
and relative humidity were only measured in one place in the
belly, these results represent the measurement location and
not necessarily the entire belly space. It likely represents
much of the interior portions of the belly, but the edge areas
may be different. The measurement location was below the kitchen
about 3/4 the way toward the center of the house from the
edge.
House
A Attic Space.
The
attic dewpoint dropped by 7.1 F. It is not certain what has
caused this since the outdoor dewpoint is the same during
both periods; however, one likely explanation is that positive
pressure in the house after repair is pushing cooler, drier
air into the attic through penetrations such as the centerline
where the two building halves are joined together. The vented
attic is clearly like the outdoors with no influence from
indoors before repair, and is about 97 % similar to outdoors
(3% influence from indoors) after repair. This would be particularly
true for a house that operated under negative pressure much
of the time (from supply dominate duct leaks). The attic dewpoint
is slightly lower than outdoors after repair likely due to
the pressurization of the house as previously mentioned due
to tight ducts and added ventilation system.
House
B Interior.
Most
of the dewpoint and pressure results in House B after repairs
were similar to House A . House B interior temperature and
relative humidity remained nearly constant. Interior wall
temperature and relative humidity conditions remained nearly
the same after repair; however, the main wall dewpoint was
4 to 5 F higher than the indoor dewpoint and the master bedroom
wall dewpoint was about 10 F higher than the indoor dewpoint.
House
B Pressure.
The
house main body pressure changed by 0.71 pa from -0.47 pa
wrt outside to 0.24 pa. The main wall pressure changed 0.61
pa from 0.31 wrt indoor to -0.30 pa while the master bedroom
wall pressure changed 0.78 pa from 0.50 pa wrt indoor to -
0.28 pa.
House
B Belly Space.
The
belly dewpoint increased by 7.4 F (13.2%). This result is
similar to House A, and is also likely attributed to the cool
dry air from duct leakage. Using the space characterization
based on dewpoint discussed for House A, the belly was 31%
similar to outdoors before repair and 63% similar to outdoors
after repairs were made as illustrated in Figure 5. The belly
space outdoor similarity increased 2.0 times more than pre
repair values indicating domination by outdoor conditions.
Zonal
Conditions House B
Table
4. Three-day period averages at House B before and after duct
repair
| |
in
db F
(C) |
in
RH % |
in
dew F
(C) |
attic
db F
(C) |
attic
RH% |
attic
dew F
(C) |
crawl
db F
(C) |
crawl
RH% |
crawl
dew F
(C) |
belly
db F
(C) |
belly
RH % |
belly
dew F
(C) |
| Pre
|
70.7
(21.5) |
47.8
|
50.0
(10.0) |
107.4
(41.9) |
52.8
|
86.4
(30.2) |
87.3
(30.7) |
56.5
|
70.0
(21.1) |
76.2
(24.6) |
49.8
|
56.2
(13.4) |
| Post
|
71.6
(22.0) |
49.6
|
51.8
(11.0) |
88.2
(31.2) |
56.3
|
70.6
(21.4) |
78.2
(25.7) |
77.3
|
70.5
(21.4) |
73.9
(23.3) |
70.4
|
63.6
(17.6) |
House
B Attic Space.
The
attic dewpoint dropped by 15.8 F, which is more than double
the amount of House A. The attic humidity appears high (Table
3) and this sensor may have been experiencing problems. The
vented attic is clearly like the outdoors with no influence
from indoors before and after repair. However, the dewpoint
went from being 16.4 F above the outdoor dewpoint before repair
to only 0.1 F greater than the outdoor after repair. House
B post-repair attic dewpoint may not show any influence from
indoor conditions because there are fewer leak pathways.
Energy
Simulation of Manufactured Homes.
Simulations
were run using measured duct leakage (CFM25out single point
test) before and after duct repair. Energy Gauge USA software
was used to run the simulations.
- Sizing
calculations show that the houses only need about 2.5 tons
a/c at most, however a 4-ton unit was used in houses for
experimental reasons.
- All
duct leakage is due to supply and simulated as if in a vented
crawlspace.
- Most
of the leakage is at AH connection and crossovers, which
will result in supply air lost to outside the conditioned
space.
Table
5: Simulation results using thermostat cooling set point at
70EF and actual size a/c*
| |
annual
kWh |
Annual
|
EG
calc. |
| |
heating
|
cooling
|
%
saved |
air
loss % |
| A
pre |
4364
|
5115
|
---
|
11.6
|
| A
post |
2364
|
4372
|
15
|
2.2
|
| B
pre |
3377
|
2767
|
---
|
7.9
|
| B
post |
2130
|
2359
|
15
|
1.6
|
*House
A size = 4 tons, House B has 2 speed system with total size
= 4 tons, but 2 tons used since it operated at 2ton capacity
most of the time.
The
problem with simulations is that one can input the size of
the leak (cfm25), but can not tell it anything about the realities
of actual leakage from just a standard CFM25 test. CFM25 does
not tell where individual holes are, the normal system pressure
across each hole, or size of each hole. If all the leakage
is small holes in low pressure parts of the system, the energy
use will be much less than if there are a few big holes (equal
total size) at high pressure.
The
standard CFM25 test and leak estimation procedure of ASHRAE
152P deviates from true measured leakage by about 24%.
(Cummings and Withers 99) Measured system operational pressure
was one of the most significant impacts. Meticulous measurements
of pressure at designed leak sites resulted in reasonably
accurate results, however single point measurement of duct
pressure resulted in poorly predicted operational leakage.
Energy Gauge USA calculates system air loss using measured
CFM25 and assumes an operational pressure based on the capacity
of the conditioning system. This means there is a potential
for error in comparing this type of simulation to standard
duct test measurements of House A and B.
Conclusions
Increasing
the airtightness of the air distribution systems 80% drastically
reduced the cooling energy required to cool house A by 16.7
kWh/day (35%), and significantly reduced it in House B by
5.5 kWh/day (17%). The coincident peak cooling power also
decreased by 1.02 kW (30%) for House A and 0.75 kW (32%) for
House B. The oversized capacity and very low thermostat set-points
enabled the savings to be as high as they are.
The
lower air flow rate of the two-speed system at House B caused
less operational duct leakage before repairs and resulted
in lower cooling energy losses than at House A. Before building
modifications, House A used 15.4 kWh per day (32%) more than
House B and 3.4 kWh per day (11%) more after modifications.
Modifying
the ventilation method involved turning off the bathroom exhaust
and installing the ventilation system. This impacted the indoor
pressure wrt outside in a beneficial way to both houses. House
A average pressure was -0.44 pa before changes and became
+0.34 pa afterwards. House B went from -0.47 pa to +0.24 pa.
Although
there were significant benefits from duct repair, increasing
belly space dewpoints after repair may be indicating greater
potential for moisture related problems for manufactured houses
with either tight or no ducts in the belly and vinyl floor
or other finishes that perform like vapor barriers. In both
houses, the belly spaces went from being more like conditioned
space to being about 2 times more like outdoor conditions.
The duct leakage had the benefit of making the belly drier
than outdoor conditions. No moisture related damage to building
materials was evident during the monitoring period.
As
a result of this and several other investigations, some general
recommendations to inhibit moisture damage potential are:
- Maintain
thermostat settings above ambient dewpoint or at least above
75 F.
- Fan
setting should be at the AUTO position.
- Use
vapor permeable finishes, avoiding vinyl wall materials
and vinyl floors.
- Crawlspaces
should be adequately ventilated and have good site drainage.
- Eliminate
long-term negative house pressures from inadequate return
pathways, duct leakage, or exhaust fans.
- Properly
size cooling equipment to encourage good moisture removal.
Acknowledgements
This research was sponsored, in large part, by the U.S. Department
of Energy, Office of Building Technology, State and Community
Programs under cooperative agreement no. DE-FC36-99GO10478
administered by the U.S. DOE Golden field office. This support
does not constitute an endorsement by DOE of the views expressed
in this report.
The
authors appreciate the encouragement and support from George
James, program manager in Washington D.C. and Keith Bennett,
project officer in Golden, CO.
This
research would not be possible without the cooperation of
Mike Dalton and his colleagues at York International, Manufactured
Housing Division (Now Stylecrest Sales) and Fleetwood Homes.
Their assistance is appreciated.
References
Moyer,
N., Beal, D., Chasar, D., McIlvaine, J., Withers, C., and
Chandra, S. 2001. "Moisture Problems in Manufactured Housing:
Probable Causes and Cures" ASHRAE Indoor Air Quality 2001.
Cummings,
J., and Withers, C. 1999. "Assessment of the Duct Leakage
Estimation Procedures of the Standard and Alternative Test
Methodologies of ASHRAE 152P." Final Report to BNL FSEC-CR-1135-99.
Florida Solar Energy Center, Cocoa, FL December 1999. |


