|
Abstract
In
partnership with the Florida Solar Energy Center (FSEC),
two manufactured homes were located on North Carolina A&T
State University’s campus in Greensboro, NC and used
in a side-by-side energy consumption comparison. One of the
homes was built to the basic HUD code standard and the other
was constructed with features expected to produce a home
that was 50% more energy efficient.
FSEC and NCATSU began monitoring energy performance in
both homes. In addition, the performance of each unit was
evaluated using a DOE2 based computer energy analysis program
developed by FSEC. A comparison of the performance of the
units shows a measured energy savings in the more energy
efficient unit of 52% for the Heating, cooling, and DHW energy
use. This compares well with the energy savings predicted
by the FSEC Energy Gauge program of 57%, even when accounting
for the warmer than usual winter experienced during the testing
period.
1.0 INTRODUCTION
As
part of a project funded by the North Carolina Department
of Administration - Energy Division, and as Part of the
US Dept of Energy’s Building America Program, researchers
in the Center for Energy Research and Technology (CERT) at
North Carolina A & T State University evaluated technologies
to improve the energy efficiency of manufactured housing.
The
partnership effort described by this report required CERT
researchers to monitor the energy use of two side-by-side
manufactured housing units on the campus of North Carolina
A & T State University in cooperation with the Florida
Solar Energy Center (FSEC). One of the units monitored was
designed and built to basic HUD code requirements [HUD, 1999]
and the other was designed to use at least 50% less energy
(Building America compliant).
As part of this study, both units were also analyzed using
the FSEC developed ENERGY GAUGE software program. This program
predicts building energy consumption using the DOE 2 analysis
engine with a user friendly front end that develops DOE2
input files and models that are more appropriate for residential
building systems.
In addition, in this second year, modifications were made
to the solar hot water heating system in the energy efficient
housing unit to help improve the performance of this system.
Further, a number of the incandescent light bulbs in the
energy unit were replaced with compact fluorescent bulbs.
These changes were staged to allow an evaluation of the effect
each of these measures had on the energy use in the homes.
The following report summarizes the results of the second
year of the effort described above (the first years results
were previously reported) [McGinley, 2002].
2.0
Standard (HUD CODE) and Energy (ENERGY EFFICIENT) Manufactured
Home Description
Each of the two manufactured homes used in this study have
1,528 ft 2 of living area, 3 bedrooms and 2 baths. Each of
the two housing units had identical floor plans. The homes
were oriented on the site with the front facing east. Both
houses were furnished. Exterior finishes were of medium color,
with dark roofs. See Figures 1 through 3.
Each home unoccupied; however incandescent lights on timers
were used to simulate occupancy loading. One of the homes
was constructed using conventional HUD code provisions and
the other was designed to be 50% more energy efficient. Construction
differences between the two homes are listed in Table 1.
The Standard housing unit used a perimeter ducting system,
while the Energy housing unit used a central trunk line.
The higher thermal resistance of the energy home building
envelope allows this more efficient central distribution
system and a reduction in compressor tonnage, which reduces
initial costs and duct losses. See Figures 1 and 2.
It
should be noted that the Energy housing unit incorporated
the use of a solar hot water heater, with a 66-gallon hot
water tank, while the “Standard” home
used an electric hot water heater with a 40-gallon tank.
Table 1 Summary of Construction of the Two
Homes
NCATSU
Side-by-Side Study of HUD Code Homes
Specifications
of Standard and Energy Construction |
Characteristic |
Standard Home |
Energy Home |
Floor Insulation |
R-11 |
R-22 |
Wall Insulation |
R-11 |
R-13 |
Ceiling Insulation |
R-20 |
R-33 roof deck radiant
barrier |
Windows |
Single Pane with Interior
Storm Windows |
Low-E Thermopane Windows |
Exterior Doors |
Storm Door on Front door
only |
Storm Door on All doors |
Marriage Wall Seal |
Fiberglass Pad |
SOF-Seal Gasket |
Heating System |
Electric Resistance Furnace |
Heat Pump HSPF7.5 |
Cooling System |
Central Air Conditioning
SEER10 - 3 ton |
Central Heat Pump SEER12
- 2.0 ton |
Water Heater |
Electric Water Heater 40
gallon capacity |
Solar
Water Heater – 66
gallon capacity |
Duct Joints |
Industry Standard |
Sealed with Mastic |
Duct System |
Perimeter Duct System |
Main Trunk Line |
House Leakage |
ACH50 = 10 |
ACH50 = 9 |
*(Note that the Energy House values for Duct Leakage and House leakage were
based on retests done after August 2001 repairs) 
Figure
1. Floor Plan and HVAC layout for the Base HUD Code (Standard) Housing
Unit (Courtesy of Palm Harbor Homes)
Figure
2. Floor Plan and HVAC Layout for the Energy Efficient (ENERGY)
Housing Unit (Courtesy of Palm Harbor Homes)
3.0 Monitoring Program
A computerized data logging system was used in each house to monitor:
- The interior temperature and relative humidity.
- The power consumption of the whole house.
- The power consumption of the air conditioning/heat pump compressor.
- The power consumption of the air handler fan.
- The power consumption of the electric resistance heat (primary heating
in the standard house, secondary heating for the energy house).
- The power consumption of water heater and electric water tank coil.
- The exterior temperature and relative humidity, solar radiation (both
parallel and at the solar panel angle), and wind speed.
The data-loggers
were connected to FSEC’s mainframe
computer via modem, and downloaded automatically. Data were sampled at
6 second intervals and recorded in hourly intervals.
All appliances in the home were unplugged except for the hot water heater,
HVAC system and some incandescent lights. There were also a few miscellaneous
devices such as the data logger, phones, and controls that show as a minor
electrical load. The incandescent lights were used to simulate an occupancy
load of 1.5 persons and were run on the following schedule; 500 watts of
lights were on 24 hours a day 7 days a week, 500 watts of lights are switched
on by timers from 4 pm to 12 pm, 200 watts of lights are switched on by
timers from 6 am to 9 am.
In addition, on weekdays, there were two hot water draws of 40 gallons
each, one in the morning and one in the late afternoon for each of the
houses. This water draw was used to simulate an average weekly water use
of a typical residence.
A comparison
of the performance of the units over the period from January 2001 to
March 2002 was made and reported in the first year report. This report
summarized the initial poor performance of the Energy housing unit that
resulted from an excessively high air-handler fan speed that significantly
reduced the efficiency of the system, a very large duct leak resulting
from an improperly set Y-connection coming off the main supply duct trunk
line, a supply duct collar failure and a poorly sealed opening around
the refrigerant line and drain between the return and supply side of
the coil plenum creating a return air bypass around the coil. These items
were repaired by September 2001 and “good” data
were obtained from September 1, 2001 to August 16, 2002.
Both homes were on cooling only mode from September 1, 2001 through October
26, 2001 at 7:00 pm. After this time, both homes were on heating only mode
until, April 16, 2002 at 2:40 pm, where they were switched over to cooling
only mode again until October, 2002. It should be noted that one of the
critical findings of the first year of the investigation indicated that
current manufactured home set up procedures may not be adequate to ensure
predicted performance of the energy efficient home units. As a result,
Palm Harbor, one of the industry partners in this investigation, has instituted
steps to improve installation/setup procedures.
It was also found that the standby losses in the solar hot water heater
in the Energy Unit were significant and on long idle periods were sufficient
to make the overall efficiency of the solar hot water heater less than
the standard electric unit. To help alleviate these stand-by losses, the
solar water tank piping insulation was upgraded on March 6, 2002 and its
effect on the water system performance was evaluated. The solar hot water
tank had a significant amount of copper and plastic tubing exposed in the
original installation configuration. Additional pipe insulation was applied
to all accessible pipe surfaces and the effects of this upgrade was evaluated.
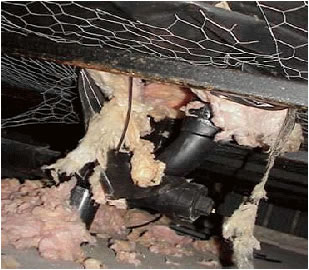
On May 1, 2002, in an effort to further improve the performance of the
solar hot water heater, the solar hot water tank in the energy unit was
wrapped with a R5 foil bubble wrap insulating blanket over the sides and
most of the top of the tank. Figure 3 shows the tank with the foil insulation
and additional pipe insulation applied.
The final modification made to the Energy Housing unit was made on June
4, 2002. At this time, three of the light fixtures that were on evening
4 hour timed duration were changed from 100 watt incandescent lamps to
25 watt compact fluorescent lamps.
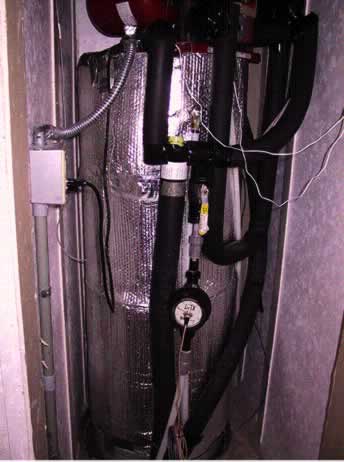
Figure
3. The Solar Hot Water Tank with R5 Insulating Blanket and additional
Pipe Insulation Located in the Energy Efficient Manufactured Housing Unit
4.0 Results and Discussion
4.1 Energy Use Results and Discussion
The measured total energy used by each of the housing units for cooling
and heating are shown in tables below. Table 2 shows the energy used for
heating and cooling the Standard Housing Unit over the period of January
through August in 2002. The Standard Unit data logger was struck by lighting
in mid August, 2002 and all data after this point was not included since
only partial data is available and comparisons of performance were not
possible. Table 3 shows a similar summary of the cooling and heating energy
used by the Energy Housing Unit.
Tables 4 and 5 show the energy used for domestic hot water production
for the Standard and Energy units, respectively for these same periods.
Table
2. Standard Housing Unit Heating and Cooling Energy Use
|
C & H
ENERGY Measured Values (kWh) |
SEPT. |
OCT. |
NOV. |
DEC. |
JAN. |
FEB. |
MAR. |
APRIL |
MAY |
JUNE |
JULY |
AUG. |
2001 values |
492 |
448 |
649 |
1741 |
2495 |
850 |
629 |
384 |
566 |
991 |
853 |
1066 |
2002 values |
|
|
|
|
2120 |
1717 |
1228 |
502 |
438 |
939 |
1079 |
511 |
Table 3. Energy Housing Unit Heating and Cooling Energy
Use
|
C & H
ENERGY Measured Values (kWh) |
SEPT. |
OCT. |
NOV. |
DEC. |
JAN. |
FEB. |
MAR. |
APRIL |
MAY |
JUNE |
JULY |
AUG. |
2001 values |
337 |
206 |
151 |
453 |
1087 |
473 |
427 |
185 |
528 |
891 |
851 |
672 |
2002 values |
|
|
|
|
681 |
537 |
378 |
242 |
312 |
603 |
668 |
627 |
Table
4. Standard Housing Unit Energy Use for Domestic Hot Water
Production
|
DHW Measured
Values (kWh) |
SEPT. |
OCT. |
NOV. |
DEC. |
JAN. |
FEB. |
MAR. |
APRIL |
MAY |
JUNE |
JULY |
AUG. |
2001 values |
198 |
268 |
250 |
213 |
0 |
0 |
218 |
245 |
258 |
227 |
208 |
214 |
2002 values |
|
|
|
|
295 |
281 |
283 |
265 |
280 |
192 |
200 |
85.2 |
Table
5. Energy Housing Unit Energy Use for Domestic Hot Water Production
|
DHW Measured
Values (kWh) |
SEPT. |
OCT. |
NOV. |
DEC. |
JAN. |
FEB. |
MAR. |
APRIL |
MAY |
JUNE |
JULY |
AUG. |
2001 values |
133 |
176 |
204 |
190 |
0 |
0 |
246 |
184 |
183 |
141 |
152 |
127 |
2002 values |
|
|
|
|
251 |
212 |
203 |
146 |
157 |
74.8 |
80.3 |
83 |
Also listed in each table are the monthly energy use measured during
the first phase of this investigation, January through August (2001). Note
that the Energy Housing Unit data prior to August 2001 is suspect due to
problems in the ducting and HVAC system, as discussed previously.
Only the cooling and heating energy, and energy used for domestic hot
water production, will be discussed in this and subsequent sections since
each housing unit was not occupied and was assumed to use essentially the
same amount of energy for the occupancy simulation. When the three incandescent
bulbs replaced with compact fluoresce bulbs in the energy unit, the reduction
in energy use for lighting load was not of concern, what was being evaluated
was the impact this change had on the cooling load in the housing unit.
The total cooling energy used by the Standard house from April 2002 to
August 16 th 2002 was 3468 kW-hrs. The total cooling energy used by the
Energy house from April 2002 to August 31 st, 2002, was 2451 kW-hrs. If
it can be assumed that about 500 kW-hr would be used for the reminder of
the August month in the Standard housing unit (~1/2 the 2001 values and
about 2 times the 2002 value), then the Energy housing unit used approximately
(1- 2451/(3468+500) x 100), or a 38.2 % less energy than the Standard unit
for cooling during this time. The totals for the same period in 2001 were
3860 kW-hr (Standard) and 3127 kW-hr (Energy), a 19 % difference. You can
see that there is an increased difference in energy efficiency of the two
housing units in the second year of monitoring during the cooling season.
This may be at least partially due to less waste heat being dumped into
the energy unit by the solar hot water heater and compact fluorescent lights.
This will be discussed later.
Over the first and second phase of this investigation there was only
one complete heating season observed. The total heating energy used by
the Standard house from November 2001 to March 2002 was 7454 kW-hrs. The
total heating energy used by the Energy house over the same time period
was 2199 kW-hr. Over this time, the Energy housing unit used approximately
70 % less heating energy than the Standard unit.
The total heating and cooling energy used by the Standard housing unit
from September, 2001 through August, 2002 was 12,365 kW-hr (a sequential
heating and cooling season). Over the same period of time, the Energy housing
unit used 5194 kW-hr, a 58% reduction.
The total
energy used for domestic hot water production from September 1, 2001
to August 16 th, 2002 in the Standard unit was 2810 kW-hr. The total
energy used for domestic hot water production from September 1, 2001
to August 31, 2002 in the Energy (Solar) unit used 1911 kW-hr of energy.
If it is assumed that the Standard unit hot water tank would used about
110 kW-hr for the rest of the August month (about ½ of
that used in previous months), the Solar hot water tank in the Energy
unit used approximately 34% less energy than the Standard unit.
Combining the energy used for domestic hot water production with that
used for heating and cooling produced a total of 15,285 kW-hr of energy
used by the Standard housing unit between September 1, 2001 and August
31 st, 2002. The Energy housing unit used a total of 7,105 kW-hr over the
same period of time. The Energy unit used 53 % less energy than the Standard
unit for heating cooling and production of domestic hot water over this
period. As will be discussed in the next section, the improvements made
on the solar hot water tank and their effects on energy use suggests that
the Energy housing unit would use even less energy than the Standard housing
unit with these changes in effect over a entire year.
4.2 Effect of Changes in the Solar Hot Tank and the Compact
Fluorescent Fixtures
The pipe insulation on the solar hot water tank was upgraded on March
6, 2002. This increase in insulation on the hot water piping appears to
have had a significant effect on the performance of the solar hot water
system and appears to have reduced the stand-by heat losses in the system.
Since no hot water draws are made on the weekends, it is possible to
examine how standby losses are influenced by system changes by looking
at this time period specifically. The stand by losses for 18 week end days
in the period of March 6 though April 30, 2002 showed that the pipe wrap
has cut standby energy losses for the energy house by about 65% (an average
of 2.43 kWh/ day (2001) vs. 0.85 kWh/day (2002)) over a similar period
last year.
In addition, the reduction of standby losses helped the solar hot water
system use less energy than the conventional electric system in the month
of March. The Standard Unit used 283 kW-hr and the solar hot water system
used 203 kW-hr, a 28.2% reduction. This reduction was further increased
in the month of April where the standard system used 265 kW-hr and the
Solar system used 146 kW-hr, a 45% reduction. It should be noted that these
values represent significant reductions in energy use when they are compared
to 2001 values where the solar system actually used more energy than the
standard unit in March 2001 and used only 25% less than the standard unit
in April 2001.
In an effort to further improve the performance of the solar hot water
heater, the water tank was wrapped with a foil bubble wrap insulating blanket
over the sides and most of the top of the tank.
Over the month
of May, the total energy used for DWH heating was 137.8 kWh for the Energy
housing unit and 249.6 kWh for the Standard housing unit. This represents
a 45% reduction in energy use for the solar hot water system, about the
same as the 45% reduction shown for the month of April.
A comparison of the tank losses over the weekends in months of April,
2002 and May, 2002 give a good indication of actual losses since there
are no tank draws on these days. This data shows an average daily week
end loss of 2.83 kWh for the Standard home and a 3.08 kWh for the Energy
home for the Month of April and an average daily week end loss of 3.92
kWh for the Standard home and a 2.97 kWh for the Energy home for the month
of May. There appears to be a little improvement in tank heat loss over
the two periods.
The total energy used over the month of June, 2002 for DWH heating was
74.8 kWh for the Energy House and 192.2 kWh for the Standard home. This
represents a 63% reduction in energy use with the solar hot water system
(compared to the 45% difference for May). This appears to indicate the
tank insulation may be having an effect on the losses in the tank. It should
be noted that the solar radiation was about the same as the month of May
(within 3%) but the water consumption was slightly less. These results
suggest that the tank wrap may be reducing some of the heat losses.
The total energy used over the month of July, 2002 for DWH heating was
80.3 kWh for the Energy House and 200.25 kWh for the Standard home. This
represents a 60% reduction in energy use with the solar hot water system.
This compares well with the June reduction of 63% with about 11% less solar
radiation in the month of July. This reduction and those in May and June
are significantly greater than the efficiencies observed in 2001 without
tank and piping insulation where energy use reductions ranged from 27%
to 40%.
The total energy used over the period of August 1, 2002 through August
15, 2002 for DWH heating was 27.13 kWh for the Energy House and 85.18 kWh
for the Standard home. This represents a 68% reduction in energy use with
the solar hot water system. This compares well with the June and July reductions
of 63 and 60%, respectively. These results appear to indicate the tank
and pipe insulation is reducing the losses in the tank, particularly the
standby losses and improving the efficiency of the solar hot water system.
To look at the impact of improved insulation of the solar hot water system
on the cooling energy used in the Energy housing unit, the total cooling
energy used for the months of March through August must be examined. To
remove the effects of the outside temperature on this evaluation, a comparison
of the percentage difference between the cooling energy used by the Standard
home and the Energy home will be made. This comparison shows that in the
months of March 2002 to August 2002 the Energy housing unit used 29% to
69% less cooling energy than the Standard housing unit. In the same period
in 2001, this reduction ranged from only 3% to 48%. This suggests that
the improvements in tank insulation may also have had a significant effect
on the cooling load within the Energy home. However, the previously described
deficiencies in the Energy Unit present in early 2001 make definite conclusions
relative to this effect difficult.
In the Energy
housing unit, three of the 100 watt incandescent lamps that were on the
evening 4 hour timed duration were exchanged for 25 watt compact fluorescent
lamps on June 4 th, 2002. This change did appear to have a small effect
on the cooling load in the Energy housing unit. The relative cooling
energy used by each of the housing units from June, 2002 through August
2002 showed a small change. The percentage reduction in cooling energy
used by the Energy housing unit increased from about 30% to 38 percent.
However, it is difficult to isolate the effects of the improvements in
the solar hot water system insulation and the effects of the compact
fluorescent bulbs. In any event, these effects appear to be much smaller
than that produced by the hot water system changes.
4.3
Energy Analysis
The two housing units described in the previous sections were analyzed
using a computer simulation program. The Energy Gauge Program (Version
1.25) developed by the Florida Solar Energy Center was used for the analysis.
The Energy Gauge Program uses the basic DOE 2 energy analysis engine to
provide an hourly energy use simulation for light commercial and residential
structures [Danny Parker, et-al, 1999]. This program was developed to provide
a simple to use interface for the DOE2 analysis program that more accurately
analyzes the energy use of single and multifamily residences, and light
commercial structures.
An analytical model was developed for each of the manufactured home units.
These models were essentially the same with differences only in the R-values
in the various building envelope components, the duct leakage values, the
heating and cooling equipment and the fenestration properties. Figure 4
shows the wire model of the building envelope configuration used for the
Standard Home. The Energy Unit model was similar.
The envelope
leakage values were measured and these values were used in the analysis
(See Table1). Table 1, and Figure 4 also show the window and door U values
as well as the HVAC system properties for the unit. In addition, a uniform
three-foot crawl space was assumed in the analysis of both houses. The
Input Summary Sheets for each of the Energy Gauge runs are shown in Figures
4 and 5. It should be noted that the solar hot water heater was not incorporated
in the analysis, a standard electrical unit was assumed in both unit’s
analyses.
The analysis
of each of the manufactured housing units was also repeated using the
newest version of the Energy Gauge program, Version 2.0. This program
was reported to have made changes in the analysis modeling and incorporated
a number of “bug fixes”. The same
input files were used for both set of analyses, Version 1.25 and Version
2.0.
Figure
4. Standard Unit Analysis Model Configuration
Figure
4a. Standard Housing Unit ENERGY Gauge Input Summary
Figure
4b.
Standard Housing Unit ENERGY Gauge Input Summary
Figure
4c. Standard Housing Unit ENERGY Gauge Input Summary
Figure
5a. Energy Housing Unit ENERGY Gauge Input Summary
Figure
5b. Energy Housing Unit ENERGY Gauge Input Summary
Figure
5c. Energy Housing Unit ENERGY Gauge Input
Summary
Table 6
shows the predicted monthly heating and cooling energy use of the Standard
housing unit for September through August (Obtained from both versions
of the Energy Gauge program). Also shown in the table is the measured
monthly energy use, as well as the percentage difference between the
measured and predicted values.
Examination
of Table 6, shows that the predicted values ranged from 13 % under
the actual usage to 265 % over the actual usage of energy. The analysis
model appears to generally underestimate the energy use in the full
cooling months and over estimate the energy use in the heating months.
Examination of Table 6 also shows that Version 2 of the Energy Gauge
program predicts a greater energy use for the Standard housing unit,
than Version 1.25. Although there is not good agreement between any
of the energy use predictions and the measured values, it appears that
the latest version of the program provides a slightly better prediction.
The reason for the discrepancy between predicted and measured values
relates to the actual weather conditions experienced by the housing
units and will be discussed later.
Table 7
shows the predicted heating and cooling energy use for the Energy housing
unit for September through August (Obtained from both versions of the
Energy Gauge program). Also shown in the table is the measured monthly
energy use, for both years as well as the percentage difference between
the measured and predicted values.
Table
6. Standard Housing Unit Analysis for Heating and Cooling
Energy Use Predicted and Measured 
Table
7. Energy Housing Unit Analysis for Heating and Cooling
Energy Use Predicted and Measured
As can
be seen by examining Table 7, the predicted values ranged from 2 %
under the actual usage to 245% over the actual usage of energy. Even
though there were problems with the ducting and HVAC system in the
Energy housing unit in early 2001, both analyses appear to generally
underestimate the energy use during the cooling (even partially cooling)
months, and significantly over estimate the energy use during the heating
months for the Energy home.
The results
of these analyses also show that Version 2 of the Energy Gauge program
predicts a greater energy use for the Energy housing unit, than Version
1.25. Again, there is not good agreement between both programs energy
use predictions and the measured values.
If we look
at the two sets of analyses we can see a similar trend in the difference
between the predicted and measured values. It is likely that a significant
amount of this can be attributed to the difference between the actual
outside temperatures and those assumed by the analysis program. To
evaluate whether this is a significant cause for the inaccuracy of
the prediction, a comparison of cooling and heating degree days can
be made for both the actual measured outside temperatures and those
assumed by the analysis programs.
The average
hourly outside temperature measured at the housing units was examined
and the heating degree day value (HDD) for each hour was calculated
using the following formula:
HDD= (65-T)/24,
T=average hourly ambient temperature
These values
were added for each 24 hour period, excluding negative values. To calculate
the HDD value for the heating months, the HDD values for all the days
of that month were added.
A similar
procedure was used for calculating the cooling degree day values (CDD),
except the following formula was used:
CDD= (T-65)/24,
T=average hourly ambient temperature
The predicted
HDD and CDD values were also calculated based on the average hourly
ambient temperatures listed in energy gauge weather data file.
The results
of this analysis are presented in Table 9. Examination of these results
indicates that the housing units experienced fewer heating degree days
than that assumed by the analysis and experienced greater cooling degree
days than assumed by the analysis. This suggests that the analysis
will generally over estimate the energy used during the heating season
and underestimate the energy used in the cooling season. This pattern
is what was observed and suggests that inaccuracies of energy use prediction
are, at least in part, weather driven. It should also be noted that
the actual home did not use the appliances assumed in the analysis
and these will provide some heat loading in the homes not present in
the actual homes.
Table
9. Cooling and Heating Degree Day Analysis Results- Both
Measured and Assumed
However,
if the predicted energy savings is compared to the actual energy savings,
a reasonable agreement is achieved. Table 7 shows that the total
cooling
and heating energy used by the Standard housing unit for the year defined
as September 2001 through August 2002 is 12365 kW-hr (adding 500 kW-hr
for energy use after Data logger failure). For the same period of time,
the Energy housing unit used 5194 kW-hr (Table 8), a 58% difference.
The yearly cooling and heating energy use difference between the Standard
and Energy housing units predicted by the Energy gauge program is 63%
for Version 2.0 and 66% for Version 1.25. This suggests good agreement
between predicted and measured energy savings and is similar to that
found by others [Parker et-al, 1998].
In addition,
the energy savings prediction for cooling, heating and domestic hot
water production is approximately as accurate with a predicted savings
of 54% (Version 2.0) to 61% and a measured savings of 53%.
It appears
that The ENERGY Gauge program gives a reasonably accurate prediction
of energy savings and Version 2.0 appears to be slightly more accurate
than Version 1.25.
5.0
Conclusions
Based on
the results of the investigation summarized in this report, it can
be concluded that
- The
changes in the building envelopes, HVAC systems (increases
in efficiency and reduction in tonnage), HVAC ducts, and fenestrations
between the HUD code and Energy efficient manufactured homes
located on the campus of North Carolina A & T State University
appear to be meeting the goal of a 50% reduction in energy consumption.
The yearly measured energy savings for heating and cooling energy
is 58%, and 53% for heating, cooling and production of domestic
hot water.
- Care
needs to be exercised in the setup of the manufactured housing units
or relatively minor construction deficiencies can significantly reduce
energy efficiency of manufactured housing units. Many of these items
are unknown to the homeowner and procedures must be developed to
ensure this does not happen in the field.
- Although
the Energy Gauge Energy analysis program did not give an accurate
prediction of energy use for typical manufactured housing configurations
over the period measured, it did appear to give a reasonably accurate
prediction of energy savings. The predicted energy savings for the
units evaluated in this investigation ranged from 54% to 63%, while
the measure values ranged from 53% to 58%. Version 2.0 of the Energy
Gauge Program appeared to provide the more accurate predictions of
energy savings.
- The
increase in pipe insulation and an increase in tank insulation increased
not only the energy efficiency of the solar hot water heater by reducing
stand-by losses but also reduced the cooling load in the manufactured
housing unit, significantly increasing the overall energy efficiency
of the unit. It appears exposed piping can significantly affect the
energy efficiency of the solar hot water heater.
- Replacement
of incandescent lamps with compact fluorescent bulbs not only reduced
lighting energy use, but also may have slightly reduced the cooling
load in manufactured housing units, while providing essentially the
same lighting levels.
6.0
References
- Code
of Federal Regulations Housing and Urban Development [HUD], Manufactured
Home Construction and Safety Standards, 24, Part 3280, US Government
Printing Office, 1999.
- McGinley,
W. M., “Study of Innovative Manufactured Housing Envelope Materials”,
Final Report to the Florida Solar Energy Center, Under the
Building America Industrialized Housing Partnership, April
2002.
- Parker,
D. et.al., 1999. "Energy Gauge® USA: A Residential Building
Energy Simulation Design Tool", Proceedings of Building Simulation ’99.
International Building Performance Simulation Association, Organizing
Committee for the 6th International IBPSA Conference, Department
of Architecture Texas A&M University, TX.
7.0
Acknoweledgements
The authors
would like to express their sincere appreciation to George James of
the US Department of Energy – Building America Program and Larry
Shirley of the North Carolina State Energy Office, Department of Administration
for their support of this investigation.
|


