


 |
|
||||
Disclaimer: This
report was prepared as an account of work sponsored by an agency
of the United States government. Neither the United States government
nor any agency thereof, nor any of their employees, makes any
warranty, express or implied, or assumes any legal liability
or responsibility for the accuracy, completeness, or usefulness
of any information, apparatus, product, or process disclosed,
or represents that its use would not infringe privately owned
rights. Reference herein to any specific commercial product,
process, or service by trade name, trademark, manufacturer, or
otherwise does not necessarily constitute or imply its endorsement,
recommendation, or favoring by the United States government or
any agency thereof. The views and opinions of authors expressed
herein do not necessarily state or reflect those of the United
States government or any agency thereof. |
|||||
Theoretical
Evaluation of the NightCool Nocturnal Radiation Cooling Concept |
|||||
|
|||||
Abstract
An evaluation has been conducted of the potential of a night sky cooling system to substantially reduce space cooling needs in homes in North American climates. The report describes the innovative residential cooling system which uses nocturnal night sky radiation from a roof integrated radiator. The system uses a sealed attic covered by a highly conductive metal roof which is selectively linked by air flow to the main zone with the attic zone to provide cooling– largely during nighttime hours. Available house mass is used to store sensible cooling. Additional dehumidification is done during the evening hours as warranted by an interior control humidistat.
The report describes a detailed simulation model of the relevant physical night cooling phenomenon, examining each particular parameter which was found to have an appreciable impact on performance. A 225 square meter metal roof structure is modeled in Tampa, Florida. Under a series of standard nighttime conditions approximating humid nighttime summer weather, the model predicts a cooling rate of about 2,140 Watts (7,300 Btu/hr). The model features several enhancements (such as constraining the radiator temperature to the dewpoint temperature) never before incorporated into such a model. The report finds that the major weather-related influences on achieved cooling performance are outdoor air temperature, dewpoint temperature, cloudiness and wind speed. Physical factors with a large influence are the system return air temperature (and hence radiator temperature) air flow rate and fan and motor efficiency. For Tampa, Florida, the model predicts an average summer cooling benefit of about 15 kWh per day for 1.4 kWh of fan power for a system seasonal energy efficiency ratio (SEER) of about 37 Btu/Wh. Performance in less humid climates with more diurnal temperature swing was predicted to be substantially better. A follow-up experimental plan is described to obtain empirical data on concept performance using two highly instrumented test sheds.
Introduction
Using a building’s roof to take advantage of radiation to the night sky as a heat sink has been long identified as a potentially productive means to reduce space cooling. Radiative cooling to the night sky is based on the principle of heat loss by long-wave radiation from one surface to another body at a lower temperature (Martin and Berdahl, 1984). In the case of buildings, the cooled surfaces are those of the building shell and the heat sink is the sky since the sky temperature is lower than the temperature of most earth bound objects.
Theoretical Potential
The night cooling resource is large and enticing for residential energy-efficiency applications. On a clear desert night, a typical sky-facing surface at 80°F (27°C) will cool at a rate of about 75 W/m2. In a humid climate with the greater atmospheric moisture, the rate drops to about 60 W/m2. Night-time cloud cover is an important variable as well. With 50% cloud cover in a humid climate, the cooling rate drops to about 40 W/m2 and only about 7 W/m2 under completely overcast skies. Average potential daily July cooling for a radiator at 72°F amounts to 63 - 110 Wh/m2 of roof surface in U.S. climate locations – the lower value being representative of a humid region like that in Florida (Clark, 1981). For a standard sized U.S. home (200 m2 of roof area), this amounts to 13 - 220 kWh of available daily cooling if the roof night sky radiation could be effectively captured. In many North American locations, the available nocturnal cooling exceeds the nighttime cooling loads and in arid desert climates may be considerably in excess of total daily cooling requirements.
Over a 10 hour night, this amounts to about 250 - 450 W/m2 if all could be effectively utilized. However, that is not easily realized. Winds add heat to the roof by convection and thus reduce beneficial heat transfer from night sky radiation. Under an average wind speed of 2 mph (0.9 m/s) – the potential diminishes by about half of the above. Also, water condensation – dew – also limits the temperature depression we can achieve for exposed surfaces.
Only a portion of the potential cooling can be obtained since the heat must be transferred from the building to the radiator and then to the sky. The rest will cool the radiator down until it gains more heat from surrounding air or reaches the dew point and is effectively lost for cooling purposes. Various physical limitations (differential approach temperature, fan power, convection and roof conductance) limits what can be achieved, so that perhaps half of this rate of cooling can be practically obtained. Even so, careful examination of air conditioner operation in many homes in Florida (Parker, 2002) shows that typical residences experience cooling loads averaging 33 kWh perday from June - September with roughly 9.2 kWh (28%) of this air conditioning coming between the hours of 9 PM and 7 AM when night sky radiation could substantially reduce cooling needs.
Trade-offs depend on many factors such as the interior convection from the radiating surface to the building as well a the fan power used to capture the cooling resource. A detailed calculation routine is provided in Appendix A evaluating these factors. However, passive systems with very little air velocity under the radiator (or those with a small circulation fan) still will achieve delivered net cooling rates of 1 - 5 W/m2. With 200 m2 of roof in a typical home that adds up to a nearly free cooling rate of 200 - 1,000 Watts (700 - 3,400 Btu/hr). Systems with higher air flow rates (800 cfm or 1,360 m3/hr), can achieve net cooling rates about twice that level.
Extensive work has examined the use of exotic night cooling schemes: roof ponds, massive roofs with moveable insulation, combined desiccant and radiative cycles and other technologies (Hay, 1978; Givoni, 1994). Often, however, issues such as operational complexity and parasitic fan power have made them unpromising.
Empirical Data on Potential of Nocturnal Cooling
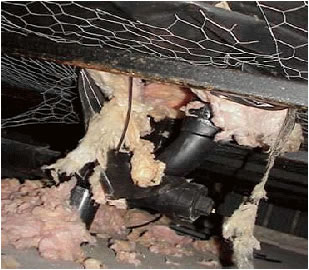
Given the complexity of the physical phenomenon, to further evaluate the potential of night cooling, we realized we could use available roof surface temperature data recorded over several years at an FSEC roof test facility (Figure 1).
The plot shown in Figure 2 shows data taken from FSEC's Flexible Roof Facility from the summer of 2001 which graphically illustrates the potential of the night cooling concept. The plotted temperature shows the 15-minute average daily roof surface temperatures of the weathered white metal roof underside temperature in test cell #6 (see Figure 1) over as compared with the outdoor air temperature and an indoor temperature target of 77°F. Within evaluation of night cooling concepts, the temperature shown is termed the stagnation temperature – the temperature a surface will drop to without any heat being added to the surface.
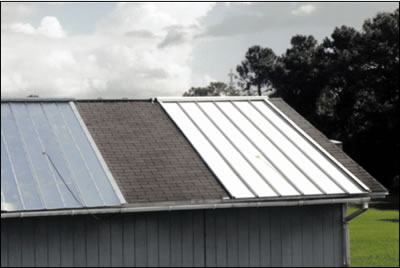 |
Figure
1. White standing seam metal
roof on the right at the Flexible Roof Facility (FRF) used to evaluate NightCool potential. |
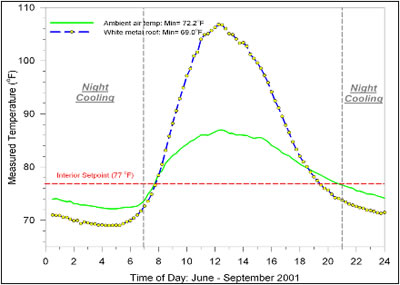 |
Figure
2. Flexible Roof Facility average metal roof temperature depression in the summer of June - September 2001. |
The nighttime temperature depression of the roof surface averages 3-4°F below the aspirated air temperature. Average depression from 9 PM to 7 AM was 3.0°F. The minimum roof surface temperature is limited by the dewpoint temperature. When the surface falls below the outdoor dewpoint temperature (typically between 72° and 74°F during summer) heat is added to the roof via this physical mechanism. Thus, the dewpoint temperature exacts a real constraint to the night sky cooling potential. Using this measured data, a series of assumptions allows a crude evaluation of the night cooling potentials. Assuming a 77°F interior setpoint, the roof surface temperature provides a temperature sink which averages 6.5°F cooler than the interior target temperature between 9 PM and 7 AM. Even assuming that there was only still air convection between the main zone and the outside night sky (Hō ~1.6 Btu/ft2/°F), this equates to about 10 Btu/ft2/hr during the average night (ASHRAE, 2001). For a 2,000 ft2 roof, that would indicate about 20,000 Btu/hr or 5,860 W (1.67 tons) of nightsky cooling, although only a portion of the cooling potential could be realized as constrained by convection within the attic space and the associated heat exchange process. However, this rate is in general agreement with the previously described estimates (Fairey, et. al., 1986).
On the other hand, the realistic cooling rate would be helped as the roof stagnation temperature depression (which is shown above in Figure 1) includes long period of where dew is adding heat to the roof which would be warmed if in communication with the indoors below (less dew). Also, the rate of radiation to the sky would be increased (to the 4th power of the Stefan-Boltzmann constant) as the roof surface temperature rose from heat transfer to the roof, increasing the cooling rate. Finally, the scheme could have some forced convection in the attic zone so that the convective surface heat transfer coefficient (Hō) would likely be in the realm of 3-4 Btu/ft2/°F. Of course these represent average conditions so some nights would be better than others.
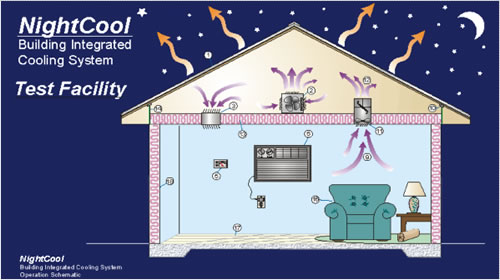
Description of the NightCool Concept
We propose an innovative night cooling system consisting of a metal roof serving as a large area, low mass highly conductive radiator (see Figure 3). The metal roof could be used at night during fall, autumn and acceptable summer periods to perform sensible cooling. It could also be used for heating during winter daytime operation where heating of the metal roof could be used to heat the home during midday and late afternoon hours when weather conditions were beneficial.
A recurring problem with night sky radiation cooling concepts have been that they have typically required exotic building configurations. These have included very expensive “roof ponds” or, at the very least, movable roof insulation with massive roofs so that heat is not gained during daytime hours (Hay, 1978; Fairey, et. al., 1990). The key element of the described configuration is that rather than using movable insulation with a massive roof or roof ponds, the insulation is installed conventionally on the ceiling. The operation of the system is detailed in the attached schematic.
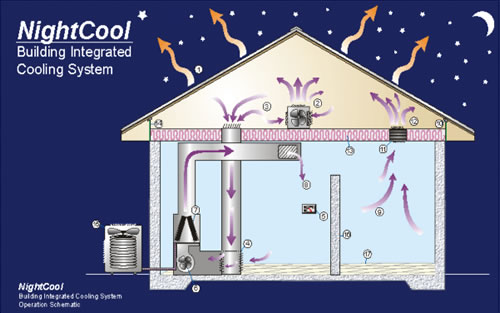 |
Figure
3. Schematic of NightCool concept. |
| 1. White
metal roof on metal battens (no decking). Both sides are surfaced
for high emissivity. A temperature probe measures roof underside
temperature. 2. Small capacity dehumidifer (such as Whirlpool AD40DBK); operates only during evening hours when thermostat and roof temperature monitor calls for cooling and attic relative humidity is greater than 55%. 3. Baffled inlet frill from attic for nighttime operation. 4. Room return inlet (for daytime operation). Closed by damper at night when temperature conditions are met. 5. Thermostat (compares roof surface temperature and setting to determine vapor compression vs. nighttime cooling operation). 6. Variable speed air handler fan with electronically commutated motor. |
7. Vapor
compression air conditioner cooling coil. 8. Interior duct system with supply outlet. 9. Interior room air return to attic during evening hours when Night Cool is activated. 10. Roofline drip collection system with drain. 11. Ceiling return for NightCool operation mode. 12. Attic air connects to cool roof for nocturnal cooling. 13. R-20 ceiling insulation. 14. Sealed attic construction with top plate baffles (tested and sealed system). 15. Air conditioner outdoor unit (condenser). 16. Concrete interior walls (thermal mass for sensible cool storage). 17. Tile floor (add thermal mass). |
During the day, the building is de-coupled from the roof and heat gain to the attic space is minimized by the white reflective metal roof. At this time the space is conventionally cooled with a down-sized air conditioner. However, at night as the interior surface of the metal roof in the attic space falls two degrees below the desired interior thermostat set point, the return air for the air conditioner is channeled through the attic space by way of electrically controlled louvers with the variable speed fan. The warm air from the interior then goes to the attic and warms the interior side of the metal roof which then radiates the heat away to the night sky.
As increased cooling is required, the air handler fan speed is increased. If the interior air temperature does not cool sufficiently or the relative humidity is not kept within bounds (<55% RH) the compressor is energized to supplement the sky radiation cooling. However, by midnight on clear nights, the temperature of the metal will have dropped sufficiently to begin to dehumidify the air introduced to the attic. The collected moisture on the underside of the roof will then drain to collection points at either side of the eaves so that the home can be dehumidified during evening hours by way of the operation of the blower fan (200-300 W). Also, if temperature conditions are satisfied, but relative humidity is not, a dedicated attic dehumidifer (note 2 on Figure 3) is energized. The massive construction of the home interior (tile floor and concrete interior walls) will store sensible cooling to reduce space conditioning needs during the following day.
Description of the Radiative Cooling Prediction Model
To objectively evaluate the potential of the NightCool concept, we created a simulation model based on the fundamental physics involved. The resulting model is described below with the spreadsheet contained in Appendix A.
Nocturnal cooling is governed by the radiation of all surfaces to the night sky via thermal radiation exchange. To further understand the mechanisms so we can apply them, we summarize the various calculations involved.
The radiation between a radiating surface and the night sky can be described by approximating the surface as a black body. The heat loss to the sky by radiation can be estimated as:
Qrad = Er(SB Trad4 - Tsky4)
Where:
Qrad = radiation heat flux to sky (W/m2)
Er = long-wave emissivity of the radiating surface
SB = Stefan-Boltzmann constant (5.67 x 10 -8 W/m2 K)
Trad = absolute temperature of the radiating surface (K)
Tsky = effective sky temperature (K)
A key parameter in the above equation is the effective sky temperature. This depends on a number of factors, but strongly on outdoor temperature, cloud cover and atmospheric moisture content. The impact of cloud on radiation is complex, but is estimated by Clark et al. (1981, 1982) to vary so that the net radiation from a cloudy sky can be roughly approximated by percent of cloud cover (Clark and Blanplied, 1979):
Ca = 1.00 +0.00224*n + 0.0035n2 + 0.0028n3
Where:
n = opaque sky cover in tenths
Thus, on average, even a cloudy sky has about 45% of the sky radiation potential of a clear sky. However, moisture also plays a major role so that humid locations see a higher effective sky emissivity and thus, less radiative cooling potential. Often these two go together– cloudy skies with moist atmospheric conditions. The clear sky emissivity can be estimated by a correlation developed by Berdahl and Martin (1984):
EClear = 0.711 + 0.56(Tdp/100) + 0.73 (Tdp/100)2
Where:
Tdp = dewpoint temperature in degrees Centigrade
The effective clear sky temperature is then:
Tclearsky = Ta (EClear0.25)
Where:
Ta = absolute ambient air temperature (K)
The effective temperature of the cloudy sky is then:
Tcloudy = (Ca)0.25 * Tclearsky
Predicting Roof/Attic Radiator Heat Exchanger Performance
To evaluate the performance of the night cooling system, it is necessary to calculate the temperature of the heat transfer to the air flowing through a one-dimensional path across the radiator as described by Santamouris and Asimakopolous (1996). This calculation is analogous to that used to evaluate heat transfer for solar collectors that use air as the heat transfer medium:
Tout - Tth = (Tfi- Tth) exp (-UpA/mcp)
Where:
Tout = outlet temperature of the air from the radiator (c)
Tth = inlet temperature of the air to the radiator (c)
A = surface area of the radiator (m2)
Up = overall heat transfer coefficient with air circulating through the radiator (W/m2-k)
mcp = air mass density product
The heat transfer coefficient (Up) from the radiator to the circulating air is then:
Up = 1/[(1/he) + (1/hf) + (drad /krad)]
Where:
he = effective combined heat transfer coefficient (W/m2-k)
hf = convective heat transfer coefficient between radiator surface and the air (W/m2-k)
drad = thickness of the radiator surface (m)
krad = thermal conductivity of the radiator surface (W/m2-k)
The interior roof surface convective heat transfer coefficient is very important within the solution of the equations as convection remains a major means to transfer heat to the roof radiator:
hn,rd,u = [9.624 (Tsurf-Tair)0.33]/[7.333-cos(β)]
Where
hn = convective heat transfer coefficients (W/m2K)
Tsurf = temperature of component surface (K)
Tair = temperature of air (K)
β = roof slope pitch angle (degrees)
Although air movement in attics is generally assumed to be dominated by natural convection, fan powered air circulation may increase surface heat transfer due to forced convection. For instance, Metais and Eckert (1964) demonstrated that a mixed convection regime between turbulent and laminar flow regimes will tend to increase free convection over the assumption of uniform turbulent flow. In order to accommodate potential forced convection, a forced convection term was added for attic surfaces to estimate its magnitude.
Peavy (1979) recommends the following relationship for turbulent flow over smooth surfaces at low air velocities (V < 3 m/s):
hf = 7.176 (Va)0.8 L-0.2
Where:
hf = forced air convection coefficient ( W/m2-K)
Va = air velocity over surface (m/s)
L = air flow path length (average length of the radiator surface, m)
The air flow path length is taken as the sum of the eave to ridge vent distance and that attic plenum height. The calculation of average air velocity over attic surfaces is problematic since interior attic air flows are complex. Ford (1982) estimates attic air flow velocity (m/s) based on the volumetric rate of ventilation over the cross sectional area of the attic perpendicular to the direction of flow:
Va = Flowsec (Vola) / Afp
Where:
Flowsec = volumetric flow rate (m3/sec)
Vola = attic volume (m3)
Afp = cross sectional area of air flow path (m2)
Unfortunately, such a calculation greatly underestimates the actual air velocities proximate to the attic heat transfer surfaces, particularly for the roof deck, since air flow through the attic is non-uniform. Unfortunately without more involved CFD fluid modeling of the attic space under the forced fan flow that would be anticipated in the operating system, the specific velocities remain an uncertainty within the model.
Based on trial and error using the model, we found that the most satisfactory solution was to take the maximum value of the solution of two equations, one for still air or low air velocities and another for forced flow regimes.
Roof Convective Heat Transfer to Outdoors
On the other side of the radiator heat balance, we need to estimate the convective heat transfer to the roof to outdoors. As shown in numerous studies, this factor has an important impact on radiative cooling systems. The convective heat transfer coefficient of the outside roof surface was approximated by assuming fully developed turbulent flow across the entire roof section. Relatively few studies have been completed on measured convection heat transfer for building exterior surfaces. However, we take a simple correlation is taken from Burch and Luna (1980):
hr = 2.8 + 4.8 (V')
Where:
hr = roof convective heat transfer coefficient (W/m2K)
V' = wind speed parallel to the roof surface (m/s)
A reduced wind speed at the roof surface was first determined using the correlation recommended by Sherman and Modera (1986) to translate weather tower wind speeds to those on site for suburban residential construction:
V' = {α,w [(Hw/10)γ,w]/[α,s (Hs/10)γ,s]} * V
Where:
α,w = alpha terrain parameter for weather tower (0.67)
Hw = height of wind tower (m) (10)
γ,w = gamma terrain parameter for weather tower (0.15)
α,s = alpha terrain parameter for site (1.0)
Hs = height of site (m) (3.0)
γ,s = gamma terrain parameter for site (0.25)
V = wind speed at measurement site (m/s)
This relationship would suggest that the rooftop estimated wind speeds for a suburban environment (Shielding and Terrain Class IV) would be roughly 55% of the wind speed velocities measured at 10 m at a standard weather station. However, we found this to be pessimistic relative to actual rooftop velocity measurements made at FSEC’s FRF facility which found wind speeds to only average 15% of the values measured at a 10 meter height at the same facility (Parker and Sherwin, 1998). This is very likely due to the influence of the roof structure itself in reducing boundary layer air velocities. As such, we used a value of 15% of the measured 10 meter wind speeds as an input to the model. This assumption will be an important one to validate within coming monitoring.
Weather Data and Assumptions
We chose to use hourly TMY2 weather data with the model to show indicated performance. Within our base case analysis, we used data for Tampa, Florida to look at performance indicators in a disadvantageous climate. The other critical input parameter is the air temperature at the inlet to the radiator. Within the modeling, we assumed that this temperature was 26°C (78.8°F) – likely representing a room temperature being maintained of 77°F (25°C). The higher assumed inlet temperature is due to internal gains from people, solar heating and appliances as well as the Nightcool circulation fan heat.
Roof Radiator Surface Temperature Balance
The predicted roof surface temperature is estimated as an energy balance taking into account the roof surface emittance properties, view factor, the sky temperature and the associated radiative, conductive and convective heat transfer coefficients. The net heat flux (Qr in Watts) of the roof radiator at a temperature (Tr) is a linear function of the effective heat transfer coefficient (he) and the stagnation temperature (Tth).
Qr = he (Tr - Tth)
he is then:
he = hr + 4 σ Ta3
Where:
hr = the roof convective heat transfer coefficient previously solved (W/m2-k)
Tth = the minimum stagnation temperature the radiator can achieve, constrained to be no less than 1 degree centigrade below the ambient dewpoint temperature (°C)
Th’ = Ta - q0/ he
Th = Max |Th’, Tdew-1|
And the net radiative power (Watts) of a black body at the ambient temperature (Ta) is produced by:
q0 = σ Ta4 - qs
And:
qs = σ ε sky Ta4
Where:
Ta = ambient air temperature (K)
σ = Stefan Boltzmann constant
εsky = sky emissivity as modified by cloudiness (dimensionless)
The air temperature at the outlet of the radiator is then determined from previously defined terms:
Tout = Tth + (Tfi- Tth) exp (-UpA/mcp)
The final result is based on the calculated system air flow rate, change in inlet to outlet temperature less the fan heat supplied to the system:
Qwatts = (1220 * Flow (m3/hr) * (Tfi- Tout)/3600) - Fanwatts
Qwatts is the hourly cooling rate produced by the system. The standard flow rate used with the model was 1360 m3/hr (800 cfm). Fan power depends on the assumed fan efficiency (40%), fan and duct static pressure (0.6 IWC or 150 pa) and motor efficiency (60%). The base calculation assumes that fan power is approximately 235 Watts to produce the base flow rate.
Using the baseline parameters given in Table 1 with the described equations, the model predicts a whole house cooling rate of 2,157 watts, or just over half a ton of night cooling. Below we evaluate model sensitivity to the large range of parameters that influence performance.
Dewpoint
Generally, the clear sky emissivity varies with the dew point temperature declining as dew point temperatures fall. This obviously varies with climate. One commonly described index to radiative cooling potential is the “sky temperature depression” which is merely the average difference between the air and sky temperature. The nightly summer average sky temperature depression varies between 5 and 10°C (9-18°F) around the U.S. Generally, dry locations have the greatest sky temperature depression – and thus the greatest potential to take advantage of radiative cooling. Figure 4 (Clark, 1981) shows a map of how the sky temperature depression average for July around the United States with a roof surface temperature of 74°F.
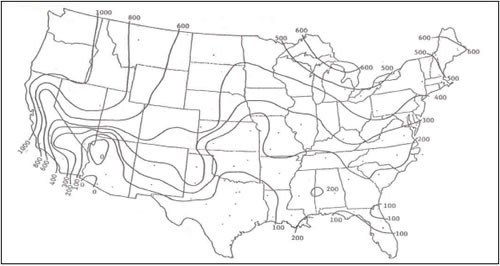 |
Figure
4. Available night sky cooling (Btu/day/ft2) around the U.S. at a 74°F radiator temperature (Clark, 1981). |
By using the model with base case simulation values shown in Table 1, we were able to evaluate sensitivity to outdoor temperature and dewpoint as shown in Figures 5 and 6 and Tables 2 and 3. Note the large sensitivity to outdoor temperature.
Table
1 Base Case Simulation Values for Analysis 2,400 ft2 Roof |
|
Parameters |
Standard
Values |
| Radiator
Thickness (metal roof) Length of Radiator (roof length) Width of Radiator (roof width) Height of Duct (attic space) Thermal Conductivity (metal conductivity) Radiator Emissivity (roof emissivity) View Factor to Sky (dimensionless) Air Velocity under Radiator (inside attic) Ambient Temperature (°C) Stefan-Boltzmann Constant Wind Velocity (w/ss) Average Cloudiness (0-10) Air Temperature at Inlet (°C) Dewpoint (°C) Air Flow (in 3/hr through plenum) Roof Tilt Angle (4/12 tilt) Fan Efficiency (fractional) Static Pressure (fan pressure) Motor Efficiency (PSC motor) |
0.002
m 15 m 15 m 1 m 16 W m-1 K 0.88 0.98 0.03 m/s 24°C 5.67E-08 2 m/s 5 27°C 22°C 1,360 m3/hr 18.4 degrees 0.4 (40%) 144 Pa (0.6 IWC) 0.6 (50%) |
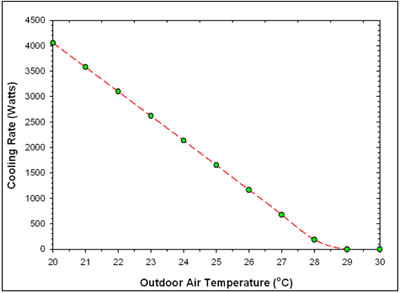 |
Figure
5. Sensitivity of predicted night sky estimated cooling
rate vs. outdoor ambient temperature for a radiator inlet temperature of 27°C. |
Table
2 Influence of Outdoor Air Temperature on Predicted Cooling Rate of NightCool Concept |
|
Ambient
Temperature (°C)1 |
Watts |
20 21 22 23 24 25 26 27 28 29 30 |
4,058 3,580 3,101 2,620 2,138 1,653 1,165 675 188 0 0 |
1
Dewpoint = Tdrybulb-2 |
|
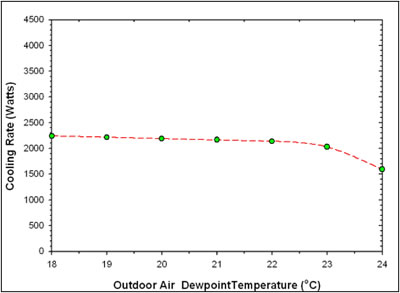 |
Figure
6. Sensitivity of predicted night sky cooling rate vs. outdoor dewpoint. |
Table
3 Influence of Outdoor Dewpoint on Predicted Cooling Rate of NightCool Concept |
|
Tdp1 (°C) |
Watts |
18 19 20 21 22 23 24 |
2,241 2,215 2,189 2,164 2,137 2,029 1,595 |
1
Ta = 24°C |
|
Emissivity and Spectral Characteristics
Building surfaces radiate to the night sky primarily in the so-called “sky window” between 8 and 13 nanometers. Thus surfaces which have their highest emittance in this range will perform best. Also, to reduce daytime heat gain, materials which are highly reflective in the short wave range (solar spectrum) will also perform best. This will also promote radiant cooling during daytime hours, as well as reflect incoming atmospheric radiation form water, dust and carbon dioxide. Best performing are white paints or other light colors with strong reflectivity in the short wave range.
Fortunately, most common building materials, other than foils or metallic paints have relatively high long-wave emissivities. These are generally in the range of 0.85 - 0.90. There are, however, some special coatings such as anodized aluminum surfaces which provide slightly greater performance, although a thorough literature review by Givoni, revealed little real efficiency gain and the strong likelihood that all surfaces would be similar once condensation has formed on the surface. In general however, such surfaces are exotic and are impractical. Non-metallic light colored surfaces will generally work well. Table 4 and Figure 7 below show the sensitivity of roof infrared emittance to night sky cooling potential.
Table
4 Influence of Emissivity on Predicted Cooling Rate of NightCool Concept |
|
Emissivity (dimensionless) |
Cooling
Watts |
0.9 0.8 0.7 0.6 0.5 0.4 0.3 0.2 |
2,157 2,057 1,949 1,832 1,706 1,570 1,425 1,270 |
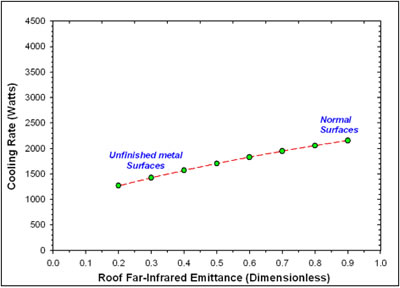 |
Figure
7. Effect of roof surface long-wave emissivity on predicted night sky cooling. |
View Factor
The extent that the roof “sees” the sky for radiative heat exchange depends on the relative angle of the emitter (roof) and absorber (the night sky). Generally, flatter surfaces will have the greatest exposure to the sky for the purposes of radiation, while those vertically inclined will not. Within everyday experience, this is the reason that frost may form on the windshield of a car, but will be much less on the vertical side windows. This factor is related to the geometry of the roof relative to the sky and is referred to as the “view factor.” This is potentially important, since radiation is a line-of-sight phenomenon, the orientation of the building surface has a lot to do with how it interacts with nocturnal radiation. Generally, the lower the roof slope, the stronger the radiation linkage to the night sky since the roof views more of the sky than the ground and local surroundings. The coldest temperatures are to be found up in the sky dome at the zenith. Then too, strongly sloped roof surfaces (5/12 or greater) generally see just about as much of the radiation from the much warmer earth and surrounding buildings and landscape, as they do from the cooler sky.
The mathematics of the view factor can be physically described for surfaces, but those looking to take advantage of the benefits of night sky radiation can simply keep in mind that lower slope roofs will work best. A simple rule of thumb is that a vertical wall with an unobstructed view (no trees or adjacent buildings) will see about a third of the sky as will a horizontal roof. The view factor for different oriented planes can be geometrically complex. However, for the simple case of a roof exposed to the sky, this “view factor” reduces to:
VF = 1+ cos ( β) / 2
Where:
VF = the dimensionless view factor that modifies radiative heat exchange
β = the roof tilt angle (degrees)
Since the roof tile angle relative to the sky is zero for a flat roof, the view factor is unity (1.0). However, common roof tilts don’t tend to reduce the view factor to a large extent. For instance, a common 5/12 roof pitch only results in a roof tile of 22.6 degrees, with a view factor of 0.965– a reduction of the potential night sky radiation of only 3.5%. Of course at very high tilts, the view factor is adversely affect (for instance a vertical surface has only about half the potential irradiance of a horizontal surface). However, impacts are limited for virtually, all typical tilt angles for common roof pitches.
Also, there are compensating physical factors. Practically, as roof pitch increases, in real roofs, the roof surface area also increases, largely compensating for the reduction to view factor. Table 5 and Figure 8 below show that the model indicates that roof irradiance does not vary significantly with roof pitch largely due to these compensating factors.
Table
5 Influence of Roof Tilt and View Factor on Predicted Cooling Rate |
|
Roof
Pitch (slope/degrees) |
Watts |
0/12
(0o) 1/12 (4.8o) 2/12 (9.5o) 3/12 (14.0o) 4/12 (18.4o) 5/12 (22.6o) 6/12 (26.6o) 7/12 (30.3o) 8/12 (33.7o) |
2,157 2,153 2,146 2,143 2,138 2,123 2,115 2,104 2,088 |
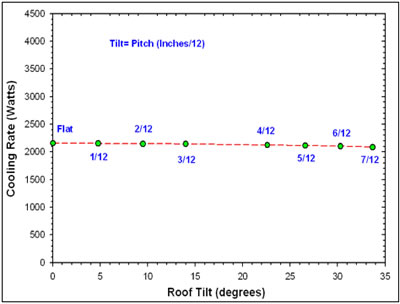 |
Figure
8. Effect of roof tilt and view factor on night sky
cooling rate. |
Wind
Night sky cooling can be strongly affected by winds. As building surfaces fall below the ambient air temperature, they begin to gain heat by air convection. Still air and windless conditions produces the least heat added to the exposed surface. Thus anything that reduces wind speeds around the radiating surfaces (without blocking the sky view) will help increase nocturnal radiation. Generally, in most developed areas this is not much trouble since, wind speeds in suburban developments at rooftop level tend to average about 10-20% of those recorded at nearby airports (Parker and Sherwin, 1998).
For instance, an 80°F roof radiating to the clear night sky at a rate of 60 Watts/m2 in a humid climate will gain about 20 W/m2 of heat from surrounding still air as it cools below the air temperature leaving about 40 W/m2 potentially available for cooling. However, the same roof with a wind speed at the roof line of 5 mph (2.25 m/s) will gain about 43 W/m2 from the surrounding air leaving less than half of the cooling potential!
However, wind is a weather factor that not much can be done about unless sophisticated schemes are considered. Ideas include the use of lightweight polyethylene films suspended above the radiators which are transparent to long wave radiation, but reduce heat gain from air movement. This is generally impractical. Again, Givoni (1994) has done some intriguing experiments verifying the added potential under various conditions. Whereas an exposed radiator under dry clear conditions was able to reach a depressed temperature about 7°C lower than ambient, the screened surface reached 9°C lower. Under cloudy skies, the temperature depressions were about 5°C and 6.5°C, respectfully. However, for humid conditions, the performance of an exposed radiator may be similar to a screened one once dew forms on the polyethylene surface. Also, the fundamental impracticality of screen radiators remains so that only uncovered radiator systems really seem practical. Figure 9 shows the model sensitivity to outdoor wind velocity.
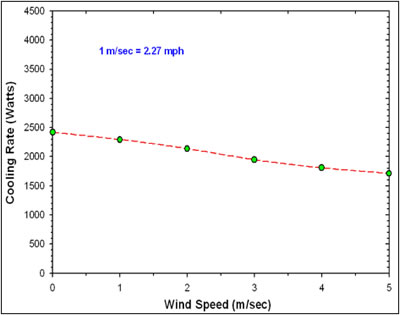 |
Figure
9. Sensitivity of predicted night sky estimated cooling rate vs. outdoor wind speed. |
Table
6 Influence of Windspeed on Predicted Cooling Rate of NightCool Concept |
|
Windspeed (m/s) |
Watts |
0 1 2 3 4 5 |
2,417 2,293 2,138 1,941 1,808 1,712 |
Cloudiness
A cloudy sky during nighttime hours is a known factor in reducing the potential for nocturnal cooling – a fact evident from the fact that frost or fog most readily occur following a clear night, but not often following those that are overcast. Clouds, particularly, low stratus and cumulus clouds, emit radiation through the entire long-wave spectrum so that under a completely overcast sky, nocturnal radiation is largely eliminated. On the other hand, clear sky conditions allows night sky radiation to reach its maximum potential, although also influenced by atmospheric moisture content.
Table 7 and Figure 10 below show how sky cloudiness influences the cooling potential of the night sky concept. Note that a completely overcast sky causes the potential to drop to approximately half of the clear sky value. The value does not drop to zero only because the outdoor ambient air temperature (24°C or 75.2°F) is less than the assumed entering temperature for the roof radiator (27°C or 20.6). However, if the entering temperature dropped to 75°F, there would no longer be any useful radiational cooling from the concept.
Table
7 Influence of Cloudiness on Predicted Cooling Rate of NightCool Concept |
|
Cloudiness (Index: 1-10) |
Watts |
0 1 2 3 4 5 6 7 8 9 10 |
2,461 2,459 2,348 2,267 2,201 2,138 2,063 1,964 1,826 1,637 1,379 |
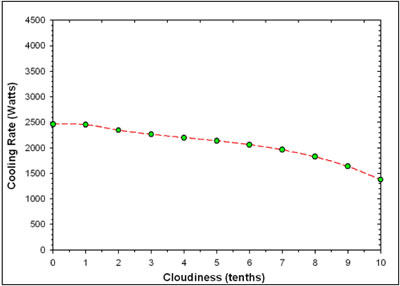 |
Figure
10. Impact of cloudiness on predicted night sky cooling
rate. |
Return Air Temperature
The temperature maintained inside the house and the return air temperature brought to the attic radiator can be expected to have a very large influence on the cooling potential. Figure 11 below illustrates this graphically. The cooling rate drops quickly as the temperature of the roof radiator is approached. Realistically, temperatures below 74°F under the base case constraints cannot achieve significant night sky cooling. However, the return air temperature is always slightly above the room temperature due to added internal gains, left over solar gains and fan heat. Given the large influence of this system operating characteristic, it becomes important to keep the return air temperature in the attic temperature as warm as possible. This means that it is important that fan and dehumidifier heat be introduced to the plenum space so that it can be readily radiated away.
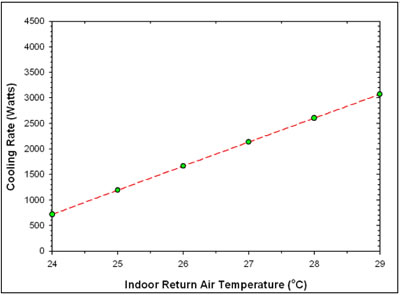 |
Figure
11. Impact of Return Air Temperature on predicted night sky cooling rate. |
Table
8 Influence of Return Air Inlet Air Temperature on Predicted Cooling Rate of NightCool Concept |
|
Return
Air Temperature (°C) |
Watts |
24 25 26 27 28 29 |
720 1,195 1,667 2,138 2,605 3,072 |
Return Air Flow Rate
The rate at which air flow is introduced to the attic plenum exacts a major impact on the cooling potential on the night sky concept. Not only does the air flow rate add heat to the roof radiator, but it also increases convective heat transfer from the attic to the roof surface with increased air velocities. However, as the flow rate is increased, the energy for the circulation fan operation goes up at the cube of the air flow. Thus, fan heat goes up with the flow rates. Note from Figure 12 that cooling rate increases rapidly as the flow rate is increased, but begins to level off as flow goes beyond 2,000 cfm. Given the large influence of system air flow rates, the cooling rate of the concept could most easily be adjusted by varying the circulation air flow through the use of a variable speed fan and brush-less DC motor combination (variable speed air handler). Conventional variable speed air handlers are capable of the rates indicated for the concept.
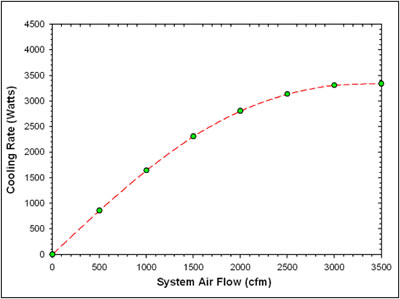 |
Figure
12. Impact of attic plenum air flow on predicted night sky cooling rate. |
Table
9
Influence of Air Flow Rate on Predicted Cooling Rate of NightCool Concept |
|
Air
Flow Rate (cfm) |
Watts |
0 500 1,000 1,500 2,000 2,500 3,000 3,500 |
0 858 1,644 2,308 2,807 3,136 3,307 3,338 |
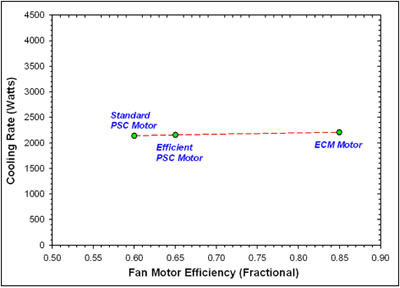
Fan Motor Efficiency
The efficiency of the fan motor directly impacts the required electrical energy for the operation of the night cooling system and thus, the overall system COP. The waste heat of the motor also reduces the performance of the cooling cycle. Figure 13 below shows the limited influence of circulation fan motor efficiency on delivered cooling. Three common types of motors are shown: command permanent split capacitor (PSC) motors (about 60% efficient), higher efficiency PSC motors (65% efficient) and the brush-less DC electronically commutated (ECM) motors which feature the highest efficiency.
Realistically, the concept would require the ECM motors as the air flow rate would almost certainly be used to throttle the night sky cooling rate. Also, the efficiency of PSC motors fall off dramatically if capacitors are used to actinically lower fan. The ECM motors do not suffer this loss in efficiency. Also, even at full speed these motors also have the advantage of being about 85% efficient.
Although the fan/motor efficiency only has a modest impact on the absolute delivered space cooling (Watts) shown in Figure 13, its influence on the efficiency with which cooling is delivered is dramatic. This is because, the fan and motor power is the overall electrical energy consumption of the cooling system and thus influences the comparative cooling efficiency. For conventional vapor compression air conditioning systems, this is rendered as the energy efficiency ratio (EER) or the seasonal energy efficiency ratio (SEER) which reflects cooling performance over the year. EER is given as Btu/Watt hour of electricity use (3.413 * the system COP). Conventional air conditioning systems have EERs of 9 -15 Btu/Wh.
Figure 14 shows that while the NightCool system delivers cooling at greater than 31 Btu/Wh with a PSC motor under the reference conditions, the efficiency is boosted by nearly 50% to over 45 Btu/Wh with an ECM motor. The impact is even larger than shown if PSC motors must have speeds modulated. When operating at lower than rated speeds, the fractional efficiency of PSC motors can decrease to 45% or less-- much lower shown in both graphs. As achieved cooling rates are most readily modulated by altering NightCool system air flow (see Figure 12), this emphasizes how the use of variable speed ECM motors are almost a necessity for successful implementation of the concept.
Table
10 Influence of Motor Efficiency on Predicted Cooling Rate of NightCool Concept |
|
Motor (Fractional Efficiency) |
Watts |
0.6 0.65 0.85 |
2,138 2,156 2,207 |
 |
Figure
13. Impact of circulation fan efficiency on predicted night sky cooling rate. |
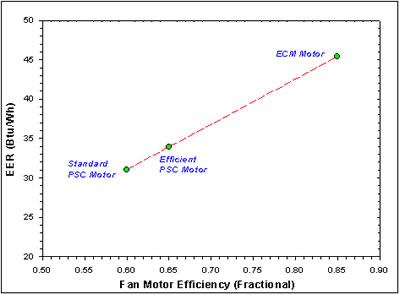 |
Figure
14. Influence of fan and motor efficiency on the predicted NightCool operating Energy Efficiency Ratio (EER). |
Analysis of Cooling Potential Using Simulation Model
Once the simulation model was created and validated against known solutions (Givoni, 1994 and Santamouris and Asimakopolous, 1996), the model was then mated to TMY2 hourly weather data in an Excel macro to predict performance around the year under realistically changing weather conditions. For the calculations we use Tampa, Florida TMY2 data adjusting the weather data wind speed to account for the greatly diminished velocity seen over roof tops in experiments done at the FRF (Parker and Sherwin, 1998). Florida weather is less advantageous for the analysis than many other locations since high summer dew points will often limit cooling potential. However, this allows evaluation of the concept under difficult environmental conditions. Also, based on the discussion above, an ECM motor was assumed to power the fan/blower assembly within the simulation.
The resulting performance was then examined for reasonableness – eliminating daytime data under other than low solar radiation where roof heating will negate cooling potential. Thus, the NightCooling system was not available anytime solar irradiance exceeded 75 Btu/ft2hr (240 W/m2) and was not activated until available cooling exceeded 1,000 Watts (3,400 Btu/hr) net of fan operation. Even when this was done, it was discovered that the model indicated that late afternoon and early morning hours would often show useful cooling potential during non-summer months. Also, periods with heavy rain during summer months would sometimes activate the cooling system for short periods. Below we show analysis for ten day periods to characterize performance in early middle and late summer.
An analysis performed for early summer is shown in Figure 15 from June 1 -10 (Julian days 152-162). During this ten day period the nighttime drybulb temperatures range from 67 - 82°F (average = 73.8°F). The average nighttime dew points are 68.6°F with a cloudiness index of 3.3.
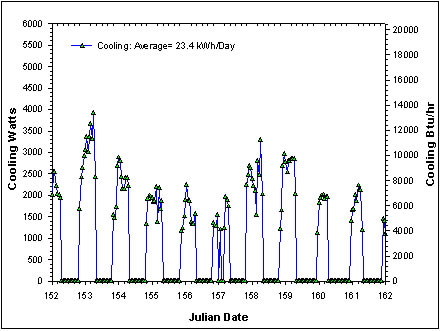 |
Figure
15. Hourly predicted cooling performance of NightCool system from June 1-10th in early summer in Tampa, Florida. |
Note within the plot the nightly pattern of activation of the system and cooling. In the early summer period, the system produces 23.4 kWh/day of daily cooling operating an average of 10.6 hours per day at a cost of 1.8 kWh of fan energy. The operating COP over this period is 13 corresponding to an EER of 44.4 Btu/Wh. The available cooling is likely in excess of what a typical efficient home would need for space cooling during evening hours.
A similar analysis for performance at the end of summer from October 1-10th is shown in Figure 16. During this ten day period the drybulb temperatures range from 58 - 78°F (average = 69.9°F) with averaged dew points of 65.5°F and a cloud index of 2.8.
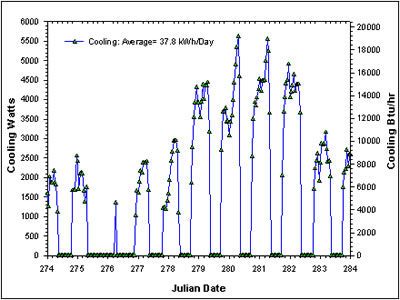 |
Figure
16. Hourly predicted cooling performance of NightCool system from October 1-10th at the end of summer in Tampa, Florida. |
As expected, the more favorable weather shows much greater cooling potentials in the milder season with 37.8 kWh of daily cooling available from 12.6 hours of daily operation at a cost of 2.1 kWh of fan energy. The operating COP is 18 for an Energy Efficiency Ration (EER) of 61.4. Again, the available cooling is considerably in excess of daily cooling needs. This would suggest that the actual performance of the system could be improved by having thermal mass in the building to store heat to be rejected during nighttime hours. I also suggest that when excess cooling is available in early summer or early fall and swing seasons that the dehumidifier could be activated to dry the building down to perhaps 5% below the target relative humidity (55%). In this fashion, the building could be dried when excess cooling energy is available to provide greater energy savings and a drier home environment.
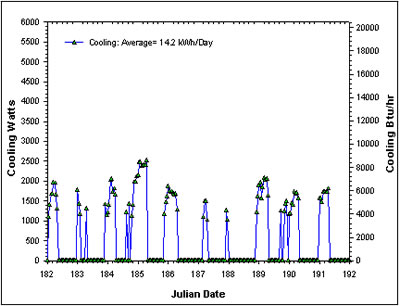
Figure 17 shows the performance of the NightCool system during peak summer conditions from July 1 -10th. During this ten day period the nighttime drybulb temperatures ranges from 70 - 84°F (average = 76.9°F) with average dew points of 71°F. As expected, the model shows diminished cooling capability during the warm humid nights prevalent during July.
 |
Figure
17. Hourly predicted cooling performance of NightCool system from July 1-10th during peak of summer conditions in Tampa, Florida. |
Note the low performance on July 6th and 7th (Julian day 187 and 188) where the system only operates 2-4 hours each night. Over the ten day period, nighttime cooling averages 14.2 kWh for the predicted 8.6 hours of daily operation against a predicted fan energy of 1.4 kWh.
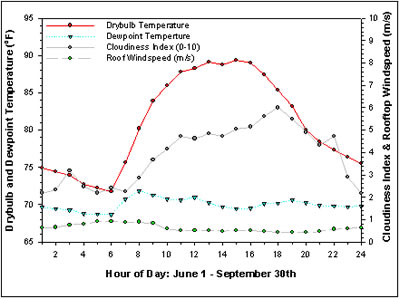
The seasonal analysis for Tampa from June - September showed that the nocturnal system would operate an average of 8.6 hours per day, producing an average of 15.2 kWh of cooling per day for a home with a consumption of fan energy of 1.4 kWh. In a typical Florida house using 33 kWh/day this could offset about 46% of required space cooling if all could be effectively utilized. The system average operating COP was 10.9 for a typical energy efficiency ratio (EER) of 37.1 Btu/Wh. This roughly corresponds to a Seasonal Energy Efficiency Ration (SEER). The average daily profile of performance is shown in Figures 18 and 19 which show weather and system performance, respectively.
 |
Figure
18. Average summer weather from June - September in Tampa, Florida. |
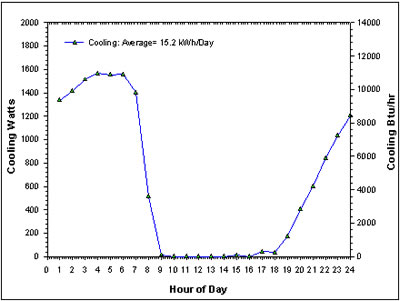 |
Figure
19. Average hourly predicted cooling performance NightCool system from June - September. |
The estimated available cooling compares favorable with measured data in Florida which showed that nighttime air conditioning cooling needs averaged 9.2 kWh. It suggest that with some dehumidification that the NightCool cooling system could reduce cooling needs. For instance, if a 500 Watt dehumidifer was used for 3 hours nightly, the combination of fan and dehumidifier energy would total 2.9 kWh against the typical AC use of 9.2 kWh– a reduction in daily AC consumption of about 6 kWh or 19%. The potential during non-summer months or in more conducive climates was expected to be considerably greater.
Simulation in Other Climates
To examine concept performance elsewhere, we conducted the same simulation in three additional climates which we expected to evidence substantially different potentials. These were Atlanta, Georgia, reflecting a more moderate cooling dominated climate, Baltimore, Maryland with a mixed heating and cooling climate and Phoenix, Arizona with an arid, very hot climate.
Results are shown in Table 11. For comparison, performance indicated from the simulation for June - September are provided alongside those for Tampa, Florida. We also provide the results for the month of July in parentheses to illustrate how the cooling potential varies during the hottest conditions in each location.
Table
11 NightCool Simulation Results for Other Climates June - September and (July Only) |
||||
Parameter |
Tampa,
FL |
Atlanta,
GA |
Baltimore,
MD |
Phoenix,
AZ |
| Avg
Daily Cooling kWh Avg Hrs per Night Fan kWh COP SEER (Btu/Whr) |
15.2
(10.8) 8.6 (7.6) 1.4 (1.3) 10.9 (8.3) 37.1 (28.4) |
50.3
(42.4) 14.3 (13.9) 2.4 (2.3) 21.0 (18.4) 71.5 (62.9) |
62.4
(45.4) 14.6 (13.6) 2.4 (2.3) 26.0 (19.7) 88.7 (67.4) |
23.2
(11.2) 7.9 (5.3) 1.3 (0.9) 17.8 (12.4) 60.9 (42.5) |
Note that each climate other than Tampa shows better performance for the concept, both in absolute cooling and in overall cooling efficiency. Atlanta and Baltimore clearly indicate the concept to produce more cooling during evening hours than could be effectively utilized. For these locations, this would suggest both interior thermal storage and nighttime dehumidification to further offset daytime cooling needs.
The very hot climate of Phoenix, however, shows that like Tampa, the concept would only be able to offset 20 - 30% of daily cooling needs, although seemingly with the potential to essentially eliminate air conditioning loads during the swing months of April - May and October. Although Phoenix has less cloud cover, and greater diurnal temperature swing, the ambient evening temperatures tend to be hotter. Consequently, in this location, the NightCool system often does not start operation until after midnight. Even so, the concept showed efficient operation in all climates along with substantial ability to offset cooling needs in more temperate locations.
However, as previously identified in the parametric analysis, the simulation is very sensitive to a number of critical assumptions which argues for an empirical assessment using test buildings under realistic weather operating conditions.
Evaluation in Small Scale Test Buildings
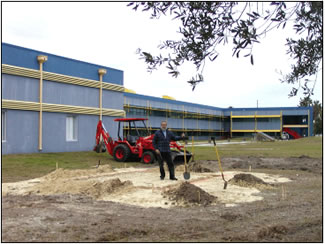 |
Figure
20. The two 10 x 16' small experimental night cool buildings are being constructed 20 ft. south of the Building Science Lab. |
To verify the potential of the concept, the radiative cooling system will be tested in two 10 x 16' test structures. These highly instrumented buildings will be located just south of the Building Science Lab (Figure 20) at the Florida Solar Energy Center (FSEC).
One of the test sheds will be the control structure with a standard attic with R-19 ceiling insulation and an asphalt shingle roof with 1:300 ventilation. The experimental unit will have a white metal roof on metal battens and a sealed attic, which can be convectively linked to the main zone by a powered circulation fan. Both units will have slab floors, frame walls and small double glazed windows. With some of the experiments additional mass will be located in the experimental unit to examine how this change influences performance.
A day/night monitoring protocol would be established with detailed instrumentation listed in Table 12. This would involve measuring air mass flow with leaving and entering temperatures to the sealed attic space under the radiatively coupled roof. Weather parameters including a pyroheliometer would be used to determine potential night cooling along with nighttime heat dissipated to the integral night sky radiator system. Small room air conditioners would be used to supply supplemental cooling. Internal loads would be simulated by switching on and off interior lamps. Experiments would be conducted to use dehumidifiers to over-dry the space during periods with excess available cooling capacity. The overall test schematic is detailed in Figure 21.
 |
Figure
21. NightCool test
schematic. |
| 1. White
metal roof on metal battens (no decking). Both sides are surfaced
for high emissivity. A temperature probe measures roof underside
temperature. 2. Small capacity dehumidifer (such as Whirlpool AD40DBK); operates only during evening hours when thermostat and roof temperature monitor calls for cooling and attic relative humidity is greater than 50-55%. 3. Baffled inlet frill from attic for nighttime operation. 5. Thermostat (compares roof surface temperature and setting to determine vapor compression vs. nighttime cooling operation). 6. Room air conditioner operated during daytime. |
9. Interior
room air return to attic during evening hours when NightCool is
activated. 10. Roof-line drip collection system with drain. 11. Variable speed, dampered fan operated during NightCool to draw house air into attic. 12. Attic air connects to cool roof for nocturnal cooling. 13. R-20 ceiling insulation. 14. Sealed attic construction with top plate baffles (tested and sealed system). 16. Furniture for internal thermal mass. 17. Concrete slab floor (thermal mass). 18. Super insulated frame walls to improve load matching with standard home. |
Once data is available on the achievable night sky cooling within the smaller test structures. Specific applications and concept improvements can be better evaluated in full scale building testing.
Table
12 Instrumentation Channel Map for NightCool Experiment |
|
Weather
|
Units °F % W/m2 mph 0-360 W/m2 inches °F lb. |
Thermal
|
°F °F °F °F °F °F °F °F °F °F |
Humidity
|
% % |
Power (1 Wh/pulse)
|
Wh Wh Wh Wh |
Conclusions
This report has described the configuration and theoretical potential of a novel residential night cooling concept. Called NightCool, the concept involves using a home's metal roof as a large radiator to the nightsky to provide effective cooling. Unlike previous more complex night cooling configurations, the innovation is to selectively link or de-couple the homes internal air node to the sealed attic under the radiator depending on the prevailing internal and external temperature conditions. It should also be possible to use the concept for daytime space heating in colder climates when the attic space is warmer than the interior and space heat would be useful.
The report provides a description of the key physical phenomenon involved as well as a numerical model predicting the systems performance. Under typical nighttime conditions in the Central Florida region, the concept is shown to produce a cooling rate averaging 2,160 Watts (7,360 Btu/hr) at a house 78°F interior temperature. The model is exercised given the various physical parameters governing its performance to determine sensitivity to the various factors. Key weather parameters are: outdoor temperature, cloudiness and windspeed. It is shown that the key system operation related parameters influences performance are: system air entering temperature and resulting radiator temperature and system air flow rate.
An analysis is also performed on hourly TMY2 data for Tampa, Florida which allowed realistic estimate of system long term performance. The evaluation found that even in Florida's disadvantageous climate that an average daily cooling of 15 kWh would be available from June through September with operating COPs of 10.9 indicative of a system SEER of 37 Btu/Wh. Simulations were also performed in differing climates.
Predicted summertime cooling in Atlanta (50 kWh), Baltimore (62 kWh), and Phoenix (23 kWh) was superior to that in humid Florida. Seasonal efficiencies in these locations corresponded to SEERs of 61-89 Btu/Wh.
Finally, we describe a side-by-side experiment using two highly instrumented scale test sheds to verify the concept. Data from these FSEC facilities should be available by 2006.
References
ASHRAE, 2001. Handbook of Fundamentals, American Society of American
Heating, Refrigerating and Air Conditioning Engineers, Atlanta, GA.
Burch, D. and Luna, D., 1980., "A Mathematical Model for Predicting Attic Ventilation Rates Required for Preventing Condensation on Roof Sheathing," ASHRAE Transactions, Vol. 86, p. 201.
Gene Clark and M. Blanpied, 1979. “The Effect of IR Transparent Windscreens on Net Nocturnal Cooling from Horizontal Surfaces,” Proceedings of the 4th National Passive Solar Conference, Kansas City, MO.
Gene Clark, 1981. “Passive/Hybrid Comfort Cooling by Thermal Radiation,” Passive Cooling: American Section of the International Solar Energy Society, Miami Beach, 1981.
Gene Clark and M. Blanplied, 1982, “Radiative and Alternative Dehumidification Strategies for Humid Climates,” Proceedings of the International PLEA Technical Conference, Bermuda.
Philip Fairey, Alp Kerestecioglu, Robin Vieira, Muthsamy Swami and Subrato Chandra, 1986. Latent and Sensible Load Distributions in Conventional and Energy Efficient Residences, FSEC-CR-153-86, prepared for Gas Research Institute, May 1986.
Philip W. Fairey et al., “An Analytical Assessment of the Desiccant Enhanced Radiative Cooling Concept,” FSEC-PF-207-90, ASME 1990 International Solar Energy Conference, Miami, FL, April 1- 4, 1990.
J. K. Ford, 1982. Heat Flow and Moisture Dynamics in a Residential Attic, Master's of Science Thesis, Center for Energy and Environmental Studies, CEES Report - 148, Princeton University, Princeton, N.J.
Baruch Givoni, 1982. “Cooling by Long-Wave Radiation,” Passive Solar Journal, Vol. 1, No. 3, p. 131-150.
Baruch Givoni, 1994. Passive and Low Energy Cooling, Van Nostrand Reinhold, NY.
Harold R. Hay, 1978, “A Passive Heating and Cooling System from Concept to Commercialization,” Proceedings of the Annual Meeting of the International Section of the Solar Energy Society, p. 262-272
Marlo Martin and Paul Berdahl. 1984. “Characteristics of Infrared Sky Radiation in the United States,” Solar Energy, Vol. 33, pp. 321-326.
B. Metais and Eckert, E.R.G., 1964. "Forced, Mixed and Free Convection Regimes," Journal of Heat Transfer, May, 1964, 1964. p. 295 - 296.
Danny Parker and John Sherwin, 1998. "Comparative Summer Attic Thermal Performance of Six Roof Constructions," ASHRAE Transactions, 1998 ASHRAE Annual Meeting, Toronto, Canada, June 20-24, 1998.
B.A.
Peavy, 1979. “A Model for Predicting the Thermal Performance
of Ventilated Attics,” Summer and Whole House Ventilation, NBS
Special Publication 548, Washington D.C.
M. Santamouris and D. Asimakopoulos, 1996. Passive Cooling of Buildings,
James & James, London.
M.H. Sherman and Modera, M.P., 1986."Comparison of Measured and Predicted Infiltration Using the LBL Infiltration Model," Measured Air Leakage of Buildings, ASTM STP 904, H.R. Treschel and P.L. Lagus, Eds., American Society for Testing and Materials, Philadelphia, p. 325-347.
BAIHP Home | Overview | Case Studies | Current Data
Partners | Presentations | Publications | Researchers | Contact Us
Copyright © 2002 Florida Solar Energy Center. All Rights Reserved.
Please address questions and comments regarding this web page to BAIHP Master