|
BAIHP
Research:
C. Field and Laboratory Building Science Research
Cont'd
- Return
Air Pathway Study
Research by BAIHP Researcher Neil Moyer with BAIHP
Industry Partner Tamarack
Scope
In effect since March 2003, Section 601.4 of the Florida
Building Code applies to residential and commercial buildings
having interior doors and one, centrally located return
air intake per heating and cooling system.
Objective Of The New Florida HVAC Code Requirement
Reduce
pressure difference in closed rooms with respect to (wrt)
the space where the central return is located to 0.01” water
column (wc) or 2.5 pascal (Pa) or less. Pressure imbalances
created by restricted return air flow from rooms isolated
from the central return by closed interior doors create
uncontrolled air flow patterns.
|
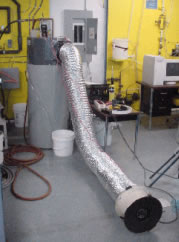
| Figure 95 Return
Air Flow Test Chamber |
Technical
Background
Ideally, forced-air heating and cooling systems circulate
an equal volume of return air and supply air through
the conditioning system, keeping air pressure throughout
the building neutral. Each conditioned space in the building
should, ideally, be at neutral air pressure at all times.
When a space is under a positive air pressure, indoor
air will be pushed outward in the walls, floor and ceiling.
When a space is under a negative pressure, air will be
pulled inward through the walls, floor and ceiling. Negative
and positive air pressures in buildings result from uncontrolled
air flow patterns.
Section 601.4 of the Florida Building Code specifically
deals with the uncontrolled air flow pattern when interior
doors are closed thereby reducing return air flow from
the closed room, while maintaining the same supply air
flow to the room. This imbalance of supply and return
air has been addressed conventionally by the common practice
of undercutting interior doors to allow return air to
flow from the room. This research quantifies the volume
of air flow provided by this and other methods of return
air egress from closed rooms.
Section
601.4 limits the air pressure imbalance in closed rooms
to 0.01” wc or 2.5 pascals when compared
to, or with respect to (wrt), the main body of
the building where the return is located. With
door undercuts, researchers have regularly observed
room pressures with respect to the main body of
the house (wrt mainbody) of +7 pascals (pa) or
more. A room with this level of air pressure (+7pa,
wrt mainbody) is trapping air, starving the heating/cooling
system of return air. As the heating/cooling system
struggles to pull in the designed amount of air,
the resulting negative pressure pulls air into
the main body of the building along the path(s)
of least resistance. Usually this means that air
is flowing through the walls, floor and ceiling
from unconditioned spaces or outside environment
to makeup for the trapped air in the closed room.
In the closed room, positive pressure builds up when
return air is trapped. Conversely, the space with the
central return gets depressurized because extra return
air is being removed to make up for the air trapped in
the closed room. More air is leaving the space (return
air) than is entering the space (supply air). The positive
pressure in the closed rooms pushes air into
unconditioned spaces, such as the attic and wall cavities.
The negative pressure in the main body of the building pulls air
from unconditioned spaces. In Florida, the air brings
heat and moisture with it that become an extra cooling
load. This air is referred to as “mechanically
induced infiltration” since the negative pressure
drawing infiltration air in was created by the mechanical
system.
Styles of Pressure Relief
When
return air flow is restricted by closed doors, it creates
pressure differences between parts of the building. This
can be prevented by installing a fully ducted return system,
by creating a passive return air pathway such as a louvered
transoms, door undercut, “jump
duct”, through-wall grilles, or a baffled through-wall
grill.
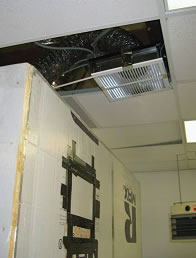
A “jump duct” is
simply a piece of flex duct attached to a ceiling register
in the closed room and another ceiling register in the
main body of the house. A jumper duct provides some noise
control while providing a clear air flow path.
|
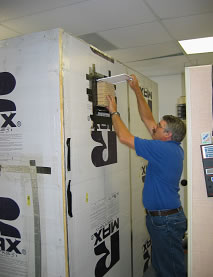
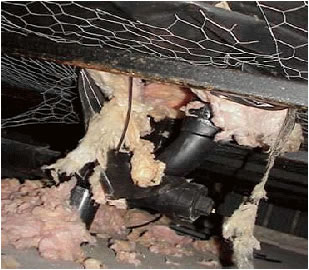
| Figure 96 Installing sound baffled return
air flow through wall insert made by Tamarack. |
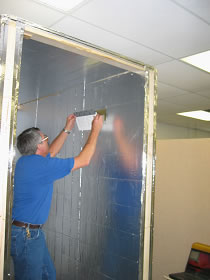
A through-wall grille is the simplest and least expensive
approach to pressure relief for closed rooms. Holes opposite
each other on either side of the wall within the same
stud bay are covered with a return air grilles. The downside
of this approach is a severe compromise the privacy of
the closed room. An improvement on this theme would be
to locate one of the grilles high on the wall and the
opposing opening low on the wall. Also, such openings
in interior wall cavities introduce conditioned air into
what is typically an unconditioned space possibly contributing
to other building problems.
However,
connecting the two openings with a sleeve of rigid ducting
forms an enclosed air flow path that limits introduction
of conditioned air into the wall cavity but doesn’t
solve the visual and sound privacy issues. To address this
problem, BAIHP Industry Partner Tamarack developed a sleeve
with a baffle that can reduce the transfer of light and
sound but still provide adequate air flow to minimize pressure
differences. The product is called a Return Air Path (RAP).
|
| Figure 97 Installing unbaffled return
air flow through wall grille |
To
validate the effectiveness of this product and other approaches
to providing return air pathways, Tamarack and BAIHP researchers
devised a test apparatus and conducted experiments in FSEC’s
Building Science Laboratory.
Testing Protocol
In
May of 2003, a chamber was constructed at FSEC (Figures
95-98) that simulated a frame construction room
with an 8 foot high ceiling. A “Minneapolis Duct
Blaster” was connected to one end of the room
with a flexible duct connection leading out of the
room to provide control over pressure in test chamber.
In
the middle of the chamber, on a stool, a radio was tuned “off station” to effectively create
a standardized level of “white noise” at
57 dBA inside the chamber with the “door” closed.
The temperature at the start of the tests was 80°F
at 40%RH. A sound meter was located outside the chamber
on a stand 4 feet above the floor and 20 inches from
the middle of the chamber wall surface.
The
sound level in the test facility outside the chamber with
the “white noise” turned off was 36.4
dBA and with the “white noise” turned on
was 41.5 dBA, an average, sampled over a 30 second period.
A series of tests on 31 different set-ups were performed,
measuring the flow at 3 different pressure levels and
recording a 30 second sound sample with the “Duct
Blaster” deactivated.
Tests
were made for 6” and 8” jump ducts,
five different sized wall openings (Figure 97) in
different configurations including straight through with
and without sleeves, straight through with sleeve and
privacy baffle (Figure 96), and high/low offset
using the wall cavity as a duct, and three different
slots simulating three different size undercut doors.
Results
Table 60 summarizes
the results of these tests arranged in ascending air flow
order based on the results at 2.5 Pascals (0.01” wc),
the maximum allowable pressure in a closed room under new
requirement in Florida Building Code, Section 601.4.
Table
60 Air Flow Resulting from Various Return Air Path
Configurations
at Controlled Room
Pressure Difference (ΔP) with respect to Return
Zone
|
Dim. |
Air
Flow (cfm) at |
Area |
Air
Flow to Area Ratio |
Return
Air Path Configuration |
Extra |
ΔP=1
pa |
ΔP=2.5
pa
|
ΔP=5
pa |
6 dia |
22 |
36 |
52 |
28 |
1.29 |
Jumper Duct |
. |
4x12 |
26 |
41 |
60 |
48 |
0.85 |
Wall Cavity |
. |
4x12 |
25 |
42 |
61 |
48 |
0.88 |
Wall Sleeve |
RAP Insert |
4x12 |
28 |
45 |
65 |
48 |
0.94 |
No Sleeve |
. |
4x12 |
29 |
46 |
68 |
48 |
0.96 |
Wall Sleeve |
. |
8x8 |
31 |
49 |
72 |
64 |
0.77 |
Wall Cavity |
. |
12x6 |
32 |
52 |
75 |
72 |
0.72 |
Wall Cavity |
. |
12x6 |
33 |
56 |
82 |
72 |
0.78 |
Wall Sleeve |
RAP Insert |
8x8 |
35 |
57 |
81 |
64 |
0.89 |
No Sleeve |
. |
8x8 |
34 |
58 |
83 |
64 |
0.91 |
Wall Sleeve |
RAP Insert |
8x8 |
36 |
59 |
85 |
64 |
0.92 |
Wall Sleeve |
. |
12x6 |
36 |
60 |
88 |
72 |
0.83 |
No Sleeve |
. |
12x6 |
37 |
60 |
88 |
72 |
0.83 |
Wall Sleeve |
. |
1 x 30 |
39 |
61 |
88 |
30 |
2.03 |
Slot |
. |
8 dia |
38 |
62 |
90 |
50 |
1.24 |
Jumper Duct |
. |
1 x 32 |
42 |
65 |
92 |
32 |
2.03 |
Slot |
. |
8x8 |
40 |
67 |
95 |
64 |
1.05 |
Wall Cavity |
Two Inside Holes |
8x14 |
44 |
70 |
100 |
112 |
0.63 |
Wall Cavity |
. |
12x12 |
45 |
72 |
103 |
144 |
0.50 |
Wall Cavity |
. |
1 x 36 |
49 |
73 |
103 |
36 |
2.03 |
Slot |
. |
8x14 |
61 |
101 |
146 |
112 |
0.90 |
Wall Sleeve |
RAP Insert |
8x14 |
68 |
107 |
153 |
112 |
0.96 |
No Sleeve |
. |
8x14 |
68 |
110 |
154 |
112 |
0.98 |
Wall Sleeve |
. |
12x12 |
75 |
119 |
170 |
144 |
0.83 |
No Sleeve |
. |
12x12 |
74 |
120 |
169 |
144 |
0.83 |
Wall Sleeve |
. |
12x12 |
74 |
120 |
174 |
144 |
0.83 |
Wall Sleeve |
RAP Insert |
|
| Figure 98 Return air flow path provided
by jumper duct |
By
comparing the air flow of the slots (door undercut) to the
openings with grilles, the detrimental effect of the grille
becomes clear. The ratio of air flow (cfm) to the surface
area of the slot (in 2) is more than 2 to 1 (for example;
30 in 2 to 61 cfm), whereas with grilles in place the ratio
of air flow to area averages 0.83 to 1 (for example; 72 in
2 to 60 cfm). Similarly, the jump duct (Figure 98) assemblies’ air
flow to area ratios average 1.19 to 1. In any calculation
for the size of the through wall assembly, the resistance
of the grille becomes the critical factor in determining
the size of the opening for achieving the desired flow.
The following formulas account for the grille resistance
and maybe used to size return air path openings.
- Door undercuts: Area Sq. In. = CFM/2
- Wall opening with grilles: Area Sq. In. = CFM/.83
- Flexible
jumper duct with grilles: Diameter = ÖCFM
Although there does not appear to be significant flow improvement
when a sleeve is used, such an assembly will reduce the possibility
of inadvertent air flow from the wall cavity itself.
The high/low grilles using the wall cavity reach maximum
flow at 72 cfm because of the dimensional limitations of
the wall cavity itself. Increasing the opening of each grille
beyond 112 square inches does not significantly increase
the flow of air through the wall cavity.
The accompanying bar chart (Figure 99) can
be used to select the best method at various air flows
while maintaining the room-to-building pressure difference
at .01” wc.
The strategies are ranked by air flow allowance (cfm) on
equivalent to supply air delivered to the room. For example,
an 8” jumper duct could be used to maintain 0.01 wc
in rooms with supply air up to 60 cfm. Note that these transfer
methods are additive so that, for example, combining a 6” transfer
duct with a 1” undercut a 30” door, will provide
a flow of 95 cfm to be delivered at .01” wc (Figure
99) or combining a R.A.P. 12.12 with a 1” undercut
would allow up to 175 cfm to be delivered . It should be
noted that door undercuts are under builder not HVAC control
and that the actual dimensions are greatly affected by the
thickness of the floor coverings.
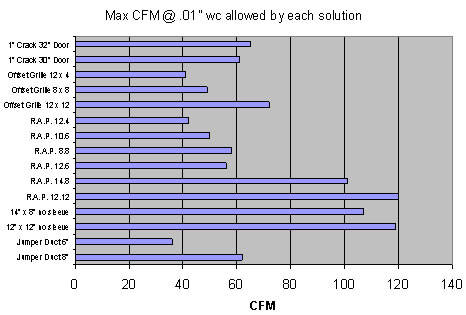
Figure
99 Maximum
air flow achievable using various return air paths
from
closed rooms for a give supply at a room pressure of 2.5
pa or
0.1” wc with respect to the return zone. For
example, an 8” jumper duct
could be used to maintain
0.01 wc in rooms with supply air up to 60 cfm.
Summary
Ideally buildings with forced air heating/cooling systems
are pressure neutral. The same amount of air is removed from
the building (and each room) as is supplied to it. However,
this balance can be disturbed in homes that have one, centrally
located return intake when interior doors are closed, blocking
return of air supplied to private rooms. Other factors outside
the scope of this study may also result in household pressure
imbalances.
These research results are relevant to homes with forced
air heating and cooling systems having a single, centrally
located return air inlet with no engineered path for return
air to exit closed rooms. Such systems pull return air from
the whole house as long as interior doors are open. When
an interior door is closed, more air is supplied to the closed
room than can be removed, or returned, from the room.
Positive
pressure builds up in the closed room while a negative
pressure occurs in the connected spaces. Positive pressure
presses outward on all surfaces and may eventually reduce
supply air flow into the closed room and while pushing conditioned
air through small breaks in the room’s air barrier.
To overcome house pressure imbalances caused by door closure, a variety of
passive return path strategies are studied including a product produced by
BAIHP Industry Partner Tamarack that overcomes privacy issues associated
with through-wall grills. Achievable air flows for jump ducts, through-wall
grilles, sleeved through-wall grilles, and the Tamarack baffled through-wall
grille are presented.
- Heat Pump Water Heater Evaluation
Research by BAIHP Researcher Carlos Colon
BAIHP researcher tested the efficiency of a heat pump
water heater manufactured by EMI, a division of ECR International.
The unit features a compressor (R-134A refrigerant) with
a wrap-around heat exchanger mounted on top of a 50-gallon
storage tank. The latest controller board model #AK 4001
was installed during the test.
|
Figure 100 Airflow
measurements using a
Duct tester on heat pump
cold
air discharge |
The
temperature regulation of the unit is achieved by an adjustable
potentiometer which sets a resistance that is measured
by the controller board and translated into the corresponding
temperatures. The set temperature is stored in the controller’s
memory.
The
controller logic is designed to operate the heat pump when
the temperature in the bottom of the tank drops below the
effective dead band temperature of 30°F
(20°F deadband + assumed stratification of 10°F).
The heat pump shuts off when the temperature in the bottom
of the tank has reached 10°F below the set point
temperature. The upper element of the tank operates only
when the temperature in the upper tank reaches 27°F
below the set point temperature.
During
laboratory testing the controller’s performance
was evaluated by measuring inlet and outlet water temperatures
using thermocouples mounted to the copper inlet and outlet
pipes as well as a Fluke hand-held thermometer inserted
into the hot water outlet stream. One minute average
measurements during draws were in agreement with the
10°F stratification logic utilized by EMI.
Also,
following a series of hot water draws during the efficiency
test (described below), the compressed refrigerant heat
was able to replenish the tank to the 130 °F
temperature level. However, following the heating recovery,
neither compressor or resistance element were activated
during standby until three days later when bottom tank
temperatures dropped below 95°F. The compressor was
called into operation when the tank was submitted to
a hot water draw which triggered the ON compressor event
in less than a minute.
Table 61 is
a summary of electrical efficiency results generated from
three tests performed in the laboratory. Tank pre-heating
for test #1 and #2 were performed in a similar way, by
forcing the compressor to turn “ON”.
The tank was allowed to loose heat on standby (1-2 days)
and then purged with a draw of at least 30 gallons of
new water. The purge forced the compressor to operate.
Preheating for the test #3 was performed with the tank
relatively hot and only twelve gallons of hot water were
purged. This might explain the higher outlet temperatures
read during test 3. For all three tests, we attempted
to heat water so that initial hot water draws were near
130 °F (+/- 5 °F). However, we noticed that temperatures
at the top of the tank (upper level) increased slightly
with each purge (i.e., 10.7 gallon draw). During the
third test shown in Table 52 for example, outlet
temperatures during the first draw averaged 129.2 °F,
but during the last draw temperatures reached an average
of 143.4 °F. The values shown for test #3 shows an
overall hot water delivery temperature (T outlet) of
136.6 °F. The controller never called for compressor
or auxiliary energy when left on standby during the completion
of the test (24-hr.).
Table
61 Electrical Efficiency Results from Laboratory
Tests |
Test |
Total
Gallons Drawn |
Average
T inlet
(°F)
|
Average
T outlet (°F) |
Total
Qout kWh |
Total
Qin kWh |
COP |
#1 |
63 |
82.3 °F |
133.2 °F |
7.756 |
3.974 |
1.95 |
#2 |
53.5 |
82.1 °F |
131.2 °F |
6.533 |
3.516 |
1.86 |
#3 |
65.9 |
82.0 °F |
136.4 °F |
8.789 |
4.254 |
2.06 |
Conclusions
The
WattSaver™ heat pump water heater is rated with
an energy factor (EF) of 2.45 and clearly demonstrates that
heating water can be accomplished at a relative higher efficiency
when compared to conventional electric water heaters. Installed
in a conditioned space, and under operation with inlet water
temperatures above 80 °F (e.g., Central Florida summer
water mains temperatures), an average electrical (COP) efficiency
of 2.0 was attained. Other measurements and performance indicators
are summarized in Table 62.
Two
caveats to the heat pump water heater’s performance
was first the delayed recovery during standby which would
present larger hot water temperature variation to the residential
user. This also leads to diminished hot water capacity during
long periods of no hot water use activity. Second, because
the compressor’s discharge refrigerant (i.e., hottest
temperatures) enter the wrap-around heat exchanger at the
top of the tank, the unit demonstrated larger hot temperature
variations at the tank’s upper levels when the top
portion was already pre-heated. These stratified tank temperature
levels differ from those obtained when heating is started
with the tank filled up with mains (colder) water conditions.
Table
62 Summary of Other Measurements and Performance
Overview |
Typical Cooling
Air Flow rate: 87 CFM (Figure 87)
Top cavity/Fan operating : -6.4 pa
Evaporator Air temp:
73 °F (63%RH
entering)
/ 53.1 °F (leaving)
Condensate: 502.6 g/hr. (1.1
lb/hr)
Sensible: 1900 Btu/hr.
Latent: 957 Btu/hr
Total Capacity : 2,857 Btu/hr
|
Current consumption
(208 VAC)
Compressor2.9 amps
Fans (2) : 0.08 Amps/each
Total 3.08 amps
|
- NightCool
- Building Integrated Cooling System
Study led by BAIHP Researcher Danny Parker
Technical Background
Using
a building’s roof to take advantage of long-wave
radiation to the night sky has been long identified as
a potentially productive means to reduce space cooling
in buildings. This is because a typical roof at 75° F
will radiate at about 55-60 W/m 2 to clear night sky
and about 25 W/m2 to a cloudy sky. For a typical roof
(250 square meters), this represents a cooling potential
of 6,000 - 14,000 Watts or about 1.5 - 4.0 tons of cooling
potential each summer night. Various physical characteristics
(differential approach temperature, fan power, convection
and conductance) limit what can be actually achieved,
so that perhaps half of this rate of cooling can be practically
obtained. Even so, careful examination of vapor compression
space cooling in many homes in Florida shows that typical
homes experience cooling loads averaging 33 kWh per day
from June - September with roughly 9.2 kWh (28%) of this
air conditioning coming between the hours of 9 PM and
7 AM when night sky radiation could greatly reduce space
cooling.
A
big problem with night sky radiation cooling concepts has
been that they have typically required exotic building
configurations. These have included very expensive “roof
ponds” or, at the very least, movable roof insulation
with massive roofs so that heat is not gained during
daytime hours. The key element of our new configuration
is that rather than using movable insulation with a massive
roof or roof ponds, the insulation is installed conventionally
on the ceiling. The operation of the system is detailed
in the attached schematic.
|
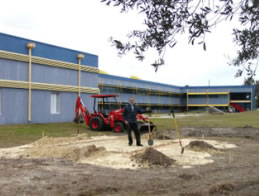
Figure
101 Groundbreaking
for the Nightcool instrumented experimental buildings,
Florida Solar Energy Center |
During
the day, the building is de-coupled from the roof and
heat gain to the attic space is minimized by a white
reflective metal roof. During this time the space is
conventionally cooled with a small air conditioner.
However, at night as the interior surface of the metal roof
in the attic space falls two degrees below the desired interior
thermostat setpoint, the return air for the air conditioner
is channeled through the attic space by way of electrically
controlled louvers with the variable speed. The warm
air from the interior then goes to the attic and warms
the interior side of the metal roof which then radiates
the heat away to the night sky. As increased cooling
is required, the air handler fan speed is increased.
If the interior air temperature does not cool sufficiently
or the relative humidity is not kept within bounds
(<55%
RH) the compressor is energized to supplement the sky
radiation cooling. A dehumidifier is used when temperature
conditions are favorable, but moisture conditions are
not. The massive construction of the building interior
(tile floor and concrete interior walls) will store
sensible cooling to reduce space conditioning needs during
the following day.
Experimental Design
To verify the potential of the concept, the radiative
cooling system will be tested in two 10 x 16' test structures.
These highly instrumented buildings are located just
south of the Building Science Lab (Figure 101) at
the Florida Solar Energy Center (FSEC). Design and siting
issues were resolved in 2004, and construction began
in 2005.
One of the test sheds will be the control structure
with a standard attic with R-19 ceiling insulation and
an asphalt shingle roof with 1:300 ventilation. The experimental
unit will have a white metal roof on metal battens and
a sealed attic, which can be convectively linked to the
main zone by a powered circulation fan. Both units will
have slab floors, frame walls and solar control small
double glazed windows.
A day/night monitoring protocol is being established
with detailed instrumentation. This would involve measuring
air mass flow with leaving and entering temperatures
to the sealed attic space under the radiatively coupled
roof. Weather parameters including a pyroheliometer would
be used to determine potential night cooling along with
nighttime heat dissipated to the integral night sky radiator
system. Small room air conditioners would be used to
supply supplemental cooling. Internal loads would be
simulated by switching on and off interior lamps. A schematic
of the test case and a similar drawing of the concept
in a real home are shown in Figures 103 and 104.
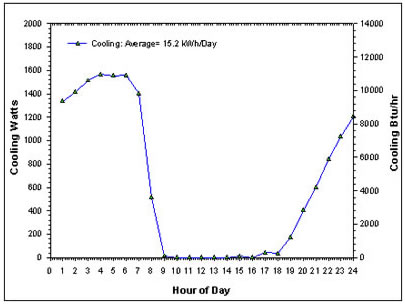
Figure 102 Average hourly
predicted cooling performance
NightCool system from June – September.
6 th Budget Period: Detailed Simulation Model
During the 6 th budget period a detailed simulation
model was created. Once the simulation model was validated
against known solutions (Givoni, 1994 and Santamouris
and Asimakopolous, 1996), the model was then mated to
TMY2 hourly weather data to predict performance around
the year under realistically changing weather conditions.
For the calculations we use Tampa, Florida TMY2 data
adjusting the weather data wind speed to account for
the greatly diminished velocity seen over roof tops in
experiments done at the Flexible Roof Facility (Parker
and Sherwin, 1998). Florida weather is less advantageous
for the analysis than many other locations since high
summer dew points will often limit cooling potential.
However, this allows evaluation of the concept under
difficult environmental conditions
The seasonal analysis for Tampa from June - September
showed that the nocturnal system would operate an average
of 8.6 hours per day, producing an average of 15.2 kWh
of cooling per day for a home with a consumption of fan
energy of 1.4 kWh. In a typical Florida house using 33
kWh/day this could offset about 46% of required space
cooling if all could be effectively utilized. The system
average operating energy efficiency ratio (EER) was 37.1
compared too 10-15 for common vapor compression air conditioners.
The average daily profile of performance is shown in
Figure 103 which shows the system performance.
Simulation in Other Climates
To examine concept performance elsewhere, we conducted
the same simulation in three additional climates which
we expected to evidence substantially different potentials.
These were Atlanta, Georgia, reflecting a more moderate
cooling dominated climate, Baltimore, Maryland with a
mixed heating and cooling climate and Phoenix, Arizona
with an arid, very hot climate.
Results are shown in Table 63. For comparison,
performance indicated from the simulation for June -
September are provided alongside those for Tampa, Florida.
We also provide the results for the month of July in
parentheses to illustrate how the cooling potential varies
during the hottest conditions in each location.
Table 63 NightCool
Simulation Results for Other Climates
June - September and (July Only) |
Parameter |
Tampa, FL |
Atlanta, GA |
Baltimore, MD |
Phoenix, AZ |
Avg Daily Cooling kWh
Avg Hrs per Night
Fan kWh
COP
SEER (Btu/Whr) |
15.2 (10.8)
8.6 (7.6)
1.4 (1.3)
10.9 (8.3)
37.1 (28.4) |
50.3 (42.4)
14.3 (13.9)
2.4 (2.3)
21.0 (18.4)
71.5 (62.9) |
62.4 (45.4)
14.6 (13.6)
2.4 (2.3)
26.0 (19.7)
88.7 (67.4) |
23.2 (11.2)
7.9 (5.3)
1.3 (0.9)
17.8 (12.4)
60.9 (42.5) |
Note that each climate other than Tampa shows better performance
for the concept, both in absolute cooling and in overall
cooling efficiency. Atlanta and Baltimore clearly indicate
the concept to produce more cooling during evening hours
than could be effectively utilized. For these locations,
this would suggest both interior thermal storage and nighttime
dehumidification to further offset daytime cooling needs.
The very hot climate of Phoenix, however, shows that like
Tampa, the concept would only be able to offset 20 - 30%
of daily cooling needs, although seemingly with the potential
to essentially eliminate air conditioning loads during the
swing months of April - May and October. Although Phoenix
has less cloud cover, and greater diurnal temperature swing,
the ambient evening temperatures tend to be hotter. Consequently,
in this location, the NightCool system often does not start
operation until after midnight. Even so, the concept showed
efficient operation in all climates along with substantial
ability to offset cooling needs in more temperate locations.
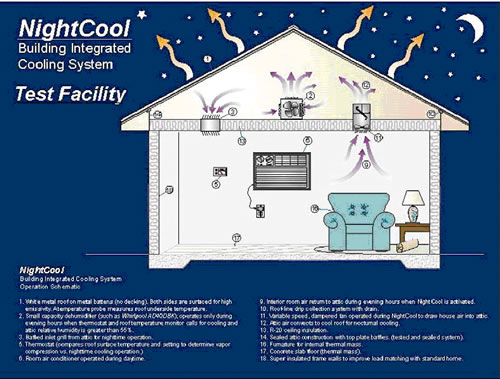
Figure 103 -Scehmatic design
for NightCool test facility.
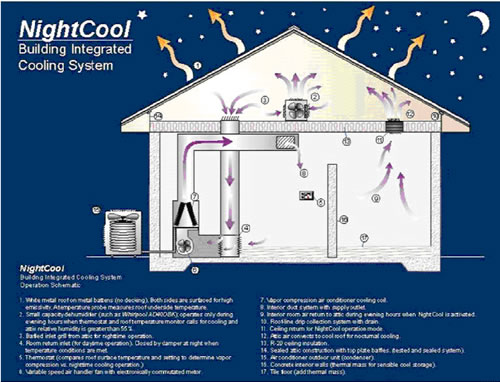
Figure 104 Schematic of NightCool
concept in typical residential building.
|


 You
are here: >
You
are here: > 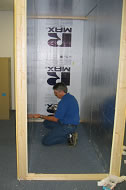