Hot Water Systems Laboratory
Research
Facility
Cocoa,
Florida
 |
Figure 1. FSEC's Hot Water Systems Laboratory. |
Solar and Conventional Water Heater Test Plan
Objectives
Conduct side-by-side tests of solar and conventional domestic hot water (DHW) systems to compare energy performance and time of day electric loads. Enhance and validate simulation models for water heating systems, especially solar integrated collector and storage (ICS) systems.
Introduction
Because of federal, state and local utility incentives, solar water heaters are once again being installed in significant numbers across the nation.
It is an excellent way to save water heating and whole house energy to
meet the U.S. DOE Building America (BA) program goals. To compare the performance of different types of solar and conventional water heaters, a test facility is currently being constructed at FSEC in Cocoa, FL to test seven
side by side systems (Figure 1).
| The HWS Lab is a laboratory facility on FSEC grounds used to test a variety of hot water systems simulataneously side by side. Data summaries can be accessed online at the InfoMonitors web site. Detailed data queries and graphs can also be generated through FSEC's WebGet database. |  |
Side by Side DHW Testing Roster
- Standard 50-gallon electric water heater (0.91 EF)
- 40 sq. ft. collector/ 80 gallon tank flat plate direct solar water heating system with a differential-controller
- 32 sq. ft. / 40 gallon integrated collector storage (ICS) system with a standard 50 gallon electric tank for backup
- 40 sq. ft. collector/ 80 gallon tank flat plate PV-pumped direct solar water heating system
- 40 gallon conventional gas water heater (EF=0.6)
- Tank less gas water heater (EF=.82)
- Tank less electric water heater (EF=.99)
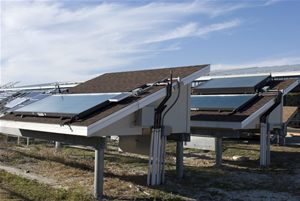
All three solar collectors have been installed (Figure 2). All tanks and tankless systems are also procured and located inside the test shed, see Figures 3 and 4. In response to a reviewer feedback the backup tank on the ICS system will be changed to 50 gallons (from 40 gallons seen in the photos). All systems should be plumbed and operational in summer of 2008 and after shakedown testing, high quality data collection should begin in fall of 2008. This work complements similar research done at NBS (now NIST) and FSEC in the 1980s (see References).
 |
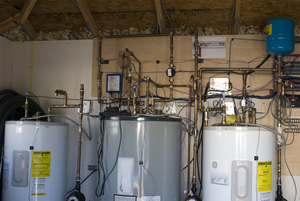 |
Figure 2. The solar collectors, with the ICS system in the rear top |
Figure 3. One half of the tanks inside the test shed |
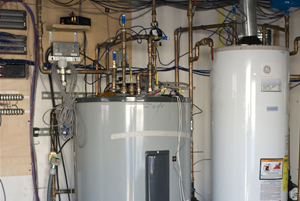 |
Figure 4. The other half of the tanks in the test shed |
Test Plan
The test plan accommodates two major objectives—
- Impose hot water draws corresponding to current FSEC system test procedures, a 64.3 gpd draw at 120F daily throughout the year. The solar tanks will have a mixing valve that tempers the output to 120 F if the tank gets hotter. The daily draw is distributed throughout the day per profile in figure 5. The ASHRAE 90.2 profile is planned.
- Impose realistic hot water draw profiles where hot water usage is greater in winter, see figure 6. The hourly draw profile for this realistic profile will be determined later after a review of available data on hot water draws in residences. The proposed draw profile will be a modification of the ASHRAE 90.2 profile. It will have no draws during evening hours from midnight to 6 AM, but will apportion this volume (approximately 3.2 gallons) equally to the 7 AM and 7 PM draws. It will also alter the draw volume monthly according to the data shown in Figure 6 below. This will see draws that are 23% higher than average in January (for instance 73.8 gallons per day) while reaching a minimum in July (46.1 gallons per day).
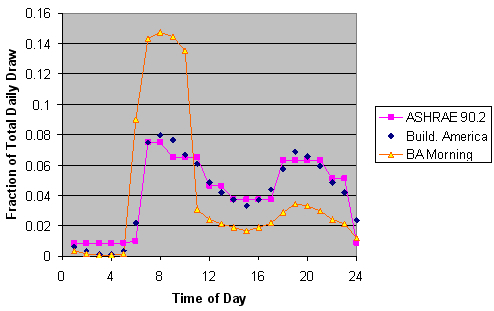 |
Figure 5. The ASHRAE 90.2 draw profile and the Building America hot water profiles |
Each profile will be alternately imposed for two weeks and the data discarded for the first two days of the bi-weekly changeover to compensate for the storage effects. Thus we will have 12 days of good data per two weeks for each of the two draw profiles throughout the one year data collection period. The draw profiles will be shifted by one hour to account for daylight savings time as appropriate. Automated controls will initialize hot water draws at the beginning of the hour and continue till the desired amount of hot water is drawn for that hour at for all systems. The draw flow rate is planned to be 1.5gpm for all draws which is close to the average draw rates found in a recent field study (Davis Energy Group, 2006).
The hot water will be dumped to a drain which will feed a storm water retention field adjacent to the testing area so that the underground aquifer can be recharged.
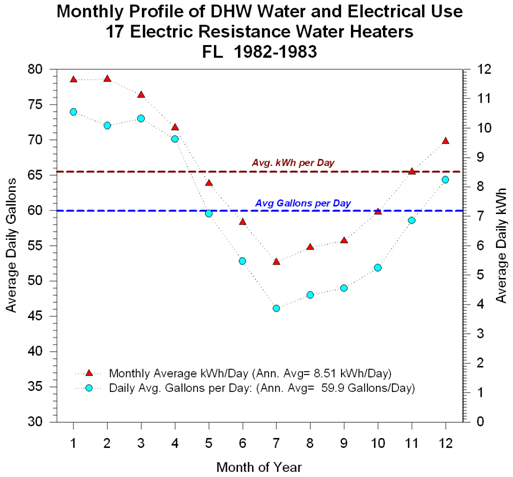 |
Figure 6. Seasonal Variation in hot water usage, Source – Merrigan 1983 |
Operation and Instrumentation Plan
Current plans are to impose the draw profile simultaneously on all seven systems (rather than one after the other). Each system has a pressure regulator to regulate the draw flow rate to 1.5 gpm and the cold water is supplied by 1.25” mains. As draw is imposed, the flowmeter pulses are totalized till the required amount of water is drawn. If operational problems related to line pressure or other issues prevent simultaneous draws, we will first try to draw four systems at once and then the other three simultaneously. If this is not satisfactory, then two systems will be drawn simultaneously, etc.
Data collection during the draws will be every 2 seconds. After the draw is completed, data for each system will be scanned as rapidly as possible but averaged and stored every 15 minutes. Data compiled from testing will be used to understand the time of day electric impact between the various systems and to help validate simulation results (TRNSYS). The performance of the ICS system is of special interest as the authors are unaware of validated simulation models for ICS systems. Additional measurements will be made for the ICS system.
The proposed instrumentation channel map and the details of each system is shown in Appendix A
Flexibility
As research data is accumulated, we will review the quality of the information being obtained and review the suitability of results with reviewers.
Should changes be necessary, they can be made after the first four weeks of the shakedown tests. Otherwise adjustment or adaptation can be made every six months within the monitoring/test protocol. We would like to hold off on changes done more often to preserve our ability to acquire long-term consistent data.
Acknowledgement
This work is being funded primarily by the U.S. Department of Energy Building America program. Several individuals at FSEC have contributed to the development of this research plan—Carlos Colon has led the construction of the test facility. Carlos Colon, Danny Parker, Subrato Chandra, Philip Fairey, Charlie Cromer, Bob Reedy, John Harrison and others have contributed to the preparation of this research plan. Danny Parker is serving as the leader for this task.
Contacts
Danny Parker dparker@fsec.ucf.edu 321-638-1405
Principal Research Scientist, FSEC
Carlos Colon carlos@fsec.ucf.edu 321-638-1435
Senior Research Engineer, FSEC
References / Bibliography
ANSI/ASHRAE Standard 90.2-1993, Energy Efficient Design of Low-Rise Residential Buildings, Section 8.9.4, “Hourly Domestic Hot Water Fraction” and Table 8-2, “Daily Domestic Hot Water Load Profile”, pp 53-54. American Society of Heating, Refrigerating and Air Conditioning Engineers, Atlanta, GA.
BA draw profile -- is figure 11 of the BA Research Benchmark Definition document
http://www.nrel.gov/docs/fy07osti/40968.pdf. The BA morning peak profile is from a TRNSYS SDHW Analysis tool file developed by NREL
Cromer, C.J. The Effect of Circulation Control Strategies on the Performance of Open Loop Solar DHW Systems, Florida Solar Energy Industry News, June 1984
Davis Energy Group, Field And Laboratory Testing of Tankless Gas Water Heater Performance, Report prepared for the California Energy Commission, April, 2006
Fairey, P. and D. Parker, A Review of Hot Water Draw Profiles Used in Performance Analysis of Residential Domestic Hot Water Systems, Florida Solar Energy Center, Cocoa, FL, July 20, 2004. FSEC-RR-56-04, online at: http://www.fsec.ucf.edu/en/publications/pdf/FSEC-RR-56-04.pdfFanney, A. H. and Klein, S.A. Performance of Solar Domestic Hot Water Systems at the National Bureau of Standards – Measurements and Predictions, J. Solar Energy Engineering, August 1983, vol. 105
Fisher R.A. and Fanney, A. H. Thermal Performance Comparisons for a Solar Hot Water System, ASHRAE Journal, August 1983
Harrison, J. and Long, S. Solar Weatherization Assistance Program, Final Report, prepared for the FL Dept of Community Affairs, Florida Solar Energy Center, FSEC-CR-1028-98, August 1998. http://www.fsec.ucf.edu/en/research/solarthermal/swap/
Merrigan, T., Residential Conservation Demonstration: Domestic Hot Water, FSEC-CR-90-83, Florida Solar Energy Center, September 1983
Std. electric 50 gal Tank
GE Model#GE50TO6AAG, Heating Elements: Upper 4500W, Lower 4500W, First Hr. Rating 67 GPH, Dimensions: 57 in.(Ht.), 19 in. (dia.), EF = 0.91
| Measurement |
| Tank Inlet water temp (F) |
| Tank Outlet water temp. (F) |
| Flow meter (gal.) |
| Tank Electric Elements (kW) |
| Tank upper temp |
| Tank Lower temp |
Std. electric 50 gal., Preheated by ICS
TCT PT40-CN, ICS Progressive Tube Collector (32.1 ft2, 41.4 gallon) , Mixing valve after backup tank (to be purchased)
| Measurement |
| Tank inlet water temp (F) |
| Tank Outlet water temp (F) |
| Outlet temp after mixing valve (F) |
| Flow meter (gal.) |
| Tank Electric Elements(kW) |
| Inlet mains temp (F) |
| ICS Inlet temp (F) |
| ICS Outlet temp. (F) |
| Tank upper temp |
| Tank Lower temp |
| ICS frame Side walls |
| Interior cavity temp |
| Glazing Temperature |
Solar System Differentially Controlled, 80 gallon storage tank w/ aux. heating element
AET D-80-40, AE-40 Collector (4’ x 10’), American Water Heater Co. Model OST-80TCE Storage Tank (80 gal.), Dimensions: 59.25” (ht.) 24” (dia.), TACO 003-BC4 pump w/DTC diff. temp controller, 4500W Aux. heating element. Mixing valve after tank set to 120F.
| Measurement |
| Tank Inlet water temp. (F) |
| Tank Outlet water temp. (F) |
| Outlet temp after mixing valve (F) |
| Solar collector Send (F) |
| Solar collector Return (F) |
| Inlet mains temp. (F) |
| Flow meter (gal.) |
| Tank Electric Element (kW) |
| Tank upper temp |
| Tank Lower temp |
Note – One time measurement of collector loop flow rate will be measured with low pressure drop turbine flow meter or detailed pipe flow calculations.
Solar System PV Pumped, 80 gallon storage tank w/ aux. heating element
AET DPV-80-40, AE-40 Collector (4’ x 10’), American Water Heater Co. Model OST-80TCE Storage Tank (80 gal.), Dimensions: 59.25” (ht.) 24” (dia.), Laing D5 pump w/10W PV Module, 4500W Aux. heating element. Mixing valve after tank set to 120F
| Measurement |
| Inlet water temp (F) |
| Tank Outlet water temp (F) |
| Outlet temp after mixing valve (F) |
| Solar collector Send (F) |
| Solar collector Return (F) |
| Inlet mains (F) |
| Flow meter (gal.) |
| Tank Electric Element (kW) |
| PV current (amps) |
| Tank upper temp |
| Tank Lower temp |
Note: How to measure collector loop flows as function of PV output? TBD
Gas Water Heater 40 gal.
GE GG40T06AVG 36 KBTU/hr., First Hr. Rating 67 GPH , Dimensions: 61.75 in.(Ht.), 17.75 in. (dia.) EF = 0.59
| Measurement |
| Inlet water temp (F) |
| Outlet water temp. (F) |
| Flow meter (gal.) |
| Gas meter (cu. ft.) |
| Flue Vent temp (F) |
| Tank upper temp |
| Tank Lower temp |
Tankless Gas Heater
Takagi TK-3, Input: 11K Btu Min., 199K Btu Max. (NG), 120V 0.77 Amp, 7.0* - .05 GPM ** *Temp Rise of 45 deg. F **0.4 GPM required for continuous fire after initial ignition, EF = 0.82
| Measurement |
| Inlet water temp (F) |
| Outlet water temp. (F) |
| Flow meter (gal.) |
| Gas meter (cu. ft.) |
| Parasitic power (W) |
| Flue Vent temp (F) |
Tankless Electric Heater
Seisco RA-22, 240 VAC Power: 22kW Max., 91 Amps (max.), 4 x 5500W heating elements (1 Gal.), EF = 0.99, 2.3 gpm at 65 deg F rise (138.7 gph)
| Measurement |
| Inlet water temp (F) |
| Outlet water temp. (F) |
| Flow meter (gal.) |
| Power (kW) |
| Line Voltage |
Miscellaneous measurements
| Measurement |
| Solar Radiation #1 (W/m2) on roof plane |
| Solar Radiation #2 (W/m2) on second roof plane |
| Solar Radiation global horiz. (W/m2) |
| Wind speed (m/s) |
| Roof surface temp (F) - Roof stand 1 |
| Roof surface temp (F) – Roof stand 2 |
| Ambient temp. (F) |
| Tank shed indoor temp (F) |