Purpose: To determine the effectiveness of filter back grills by testing the airflow through various duct and filter systems.
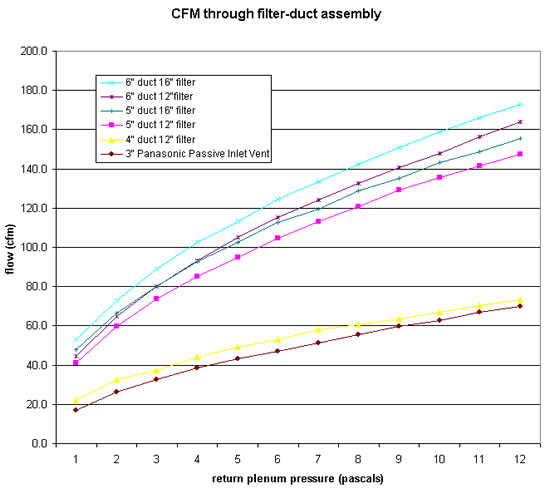
Types of Duct and Filter Systems: There were six different systems used in this experiment, each of which was tested for the allowed airflow at various pressure differences. The six systems were:
- 6” duct with a 16”x16” filter
- 6” duct with a 12”x12” pleated filter
- 5” duct with a 16”x16” filter
- 5” duct with a 12”x12” pleated filter
- 4” duct with a 12”x12” pleated filter
- 3” Panasonic passive inlet vent
Setup:
The picture below shows the basic setup and components for
the experiment.
The setup begins with the filter box which contained the filter and grill along with the beginning connection of the ductwork. This box was fitted for all three sizes of ducts and both sizes of filters. The filter box was then connected via the duct to the pressure box, which was also fitted for each of the three duct sizes. The duct blaster was then connected to the opposite end of the pressure box. The only exception is that the 3” Panasonic passive inlet vent was connected directly into the pressure box and did not have any ducts attached to it. Two pressure monitors were also used. One measured the pressure across the duct blaster and the other measured the difference in pressure between the interior of the pressure box and the outside. All of the duct installations were sealed with mastic as were the grill and various potential leak areas throughout the boxes and ducts. Duct mast was used to seal the fittings for ducts not currently in use, i.e. when studying the effect of 6” ductwork the 5” connection to each box was sealed with duct mast.
Procedure: Once the setup has been completed for a particular run the grill is initially sealed with duct mast. Next, the duct blaster is turned on and increased in power until pressure differences were reached between the pressure box and the outside. At increments of 5 between zero and 60 pascals a reading of the pressure difference across the duct blaster would also be measured. These calculations showed the error or leak involved with the specific ductwork and filter size being used. Then the duct blaster was shut off and the duct mast was removed from the grill. The duct blaster was again turned on and increased in power to create pressure differences between the pressure box and the outside. Once again measurements of the fan pressure were taken at increments of 5 pascals between 0 and 60. Once these measurements had been tallied the duct blaster was shut down and the setup was altered for the next system to be tested and the testing process was repeated. This was done for each of the six systems. After collecting the data it was necessary to convert the pressure across the duct blaster from pascals to cfm’s. The table below shows the process of converting the data using the data for a 4” duct with a 12”x12” pleated filter.
Pressure
across Duct Blaster (pascals) |
Error
or Leak Value |
Corrected
Pressure across Duct Blaster (pascals) |
Airflow
through system (cfm) |
|
0 |
0 |
0 |
0 |
0 |
5 |
2.6 |
0.5 |
2.1 |
22.2 |
10 |
5.5 |
1 |
4.5 |
32.5 |
15 |
7.7 |
1.8 |
5.9 |
37.2 |
20 |
10.7 |
2.4 |
8.3 |
44.1 |
25 |
13.3 |
3 |
10.3 |
49.1 |
30 |
15.6 |
3.6 |
12 |
53 |
35 |
18.4 |
4.1 |
14.3 |
57.9 |
40 |
20.7 |
5.1 |
15.6 |
60.5 |
45 |
23.1 |
5.8 |
17.3 |
63.7 |
50 |
25.7 |
6.5 |
19.2 |
67.1 |
55 |
28.2 |
7 |
21.2 |
70.5 |
60 |
30.8 |
8 |
22.8 |
73.1 |
First the leak or error value at each increment is subtracted from the experimental value. Next the corrected value is raised to the 0.5 power and multiplied by 15.31 (the specific formula for the white duct blaster with ring three). This converts pascals to cfm’s and shows the airflow at each pressure difference. Finally this information was plotted to show not only the airflow but also the differences between the systems. The graph below shows the final results of the experiment.