Greensboro, North Carolina
 North
Carolina A&T University (NCATU) is a BAIHP partner that
has procured two high
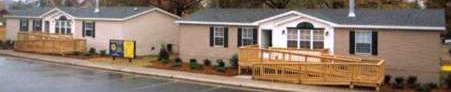
visibility manufactured homes on its campus in Greensboro,
NC. Built by Palm Harbor Homes, Siler City, they have 1,528
sq. feet of living area, with 3 bedrooms and 2 baths.
North
Carolina A&T University (NCATU) is a BAIHP partner that
has procured two high
visibility manufactured homes on its campus in Greensboro,
NC. Built by Palm Harbor Homes, Siler City, they have 1,528
sq. feet of living area, with 3 bedrooms and 2 baths.
During
testing, each model house was unoccupied; however, the use
of lights and appliances were simulated with timers. One
of the homes was conventional and the other was expected
to be 50% more energy efficient. Measured data shows that
an overall savings of 55% was achieved for the combined
heating, cooling and water heating loads, surpassing the
design goal! Good data collection periods were:
Season |
Dates |
Savings |
Heating
season |
Nov
1, 2001 - April 14, 2002 |
70% |
Cooling
Season |
April
16, 2002 - August 15, 2002 |
33% |
Water
heating |
August
16, 2001 - August 15, 2002 |
33% |
Construction differences between the two homes are listed in the table below. The results of testing are described below.
| FSEC and NCATU monitored energy performance in both homes. All data was downloaded daily to FSEC via modem. Data summaries can be accessed online at the InfoMonitors web site. Detailed data queries and graphs can also be generated through FSEC's WebGet database. |  |
Heating Energy Savings
| Heating Avg. | Heating Max. | |
| Base House | 1.95 kW | 3.23 kW |
| Energy House | 0.58 kW | 0.96 kW |
| Savings | 70% |
70% |
Data collected From Nov 1, 2001 through April 14, 2002 show an average heating energy savings of 70% and an average peak kW savings of 70%.
Average hourly data during the period is plotted below. It shows an average 24 hour period over the months of November, 2001 thru April, 2002.
Interior temperatures in the base house averaged 74.8 over this period, while the energy house averaged 74.3.
 |
|||
Daily
average HVAC energy use from Nov. 1, 2001 through
Apr. 14, 2002 |
Heating Peak Day
 Below
is a plot of the heating energy use at the NC A&T demonstration
homes on the likely heating peak day for 2001-2002 of Friday,
January 4th.
Below
is a plot of the heating energy use at the NC A&T demonstration
homes on the likely heating peak day for 2001-2002 of Friday,
January 4th.
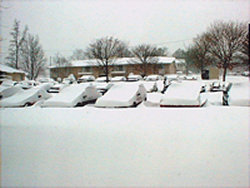
The 99% design dry bulb temperature for Greensboro, NC is 19°F; the temperature on this day reached a low of 15.9°F at 6:45 AM. The area has received considerable snowfall in recent days. The average temperature was 31.8 F over the course of the day (red line on plot).
The total measured heating power for the base house with electric resistance heat was 109.3 kWh (green line on plot). The heat pump used a total of 39.7 kWh with auxiliary strip heat being used during the coldest part of the morning (see spikes between 4 and 9 AM on blue dashed line) .
This corresponds to a savings of 64% in space heating on the likely coldest day of the year-- capping off excellent performance for the project.
Cooling Energy Savings
| Cooling Avg. | Cooling Max. | |
| Base House | 1.12 kW | 2.01 kW |
| Energy House | 0.72 kW | 1.18 kW |
| Savings | 33% |
41% |
Data collected From April 16, 2002 through August 15, 2002 show an average cooling energy savings of 33% and an average peak kW savings of 41%.
Average hourly data during the period is plotted below. It shows an average 24 hour period over the months of April, 2002 thru August, 2002.
Interior temperatures in the base house averaged 73.3 over this period, while the energy house averaged 73.2.
Daily
average HVAC energy use from Apr. 16, 2002 through Aug. 15,
2002
Cooling Peak Day
Below is a plot of the cooling energy use at the NC A&T demonstration homes on the cooling peak day for 2001-2002 of Tuesday, August 13th.
The 1% dry bulb tempearture for Greensboro, NC is 90°F; the temperature on this day reached a high of 105°F at 1:45PM. The average temperature was 87.8°F over the course of the day (red line on plot).
The total measured cooling energy for the base house with SEER 10 central air conditioning was 44.4 kWh (green line on plot) while the energy house with SEER 12 central heat pump was 28.0 kWH (blue line on plot). This corresponds to a savings of 37% in cooling on the likely hottest day of the year.
Hot Water Energy Use
| . | HW Power Avg. |
| Base House | 0.33 kW |
| Energy House | 0.22 kW |
| Savings | 33% |
Data collected From Aug 16, 2001 through Aug 15, 2002 show an average hot water energy savings of 33%. The base house averaged 0.33 kW while the energy house averaged 0.22 kW
Average hourly data during the period is plotted below. It shows an average 24 hour period over the year of Aug, 2001 -2002.
Both the base house and energy house averaged 52.8 gallons/day over this period.
The solar water heating system in the Energy house saved 33% of the water heating energy. The solar water heating system is an antifreeze system consisting of two 3'x7' solar collectors and a 66 gallon storage tank. The solar collectors are partially shaded in the late afternoon by large trees on the west side.
In an effort to improve the solar system performance, NCATU researchers insulated the tank piping on March 6, 2002 and installed additional tank insulation on May 1, 2002. The following table illustrates the performance for comparable periods in 2001 (before pipe and tank insulation) and 2002 (after insulation).
Water Heating Energy
Use |
||||||||
May
2001 |
June
2001 |
July
2001 |
May
- July 2001 |
|||||
House |
Base |
Energy |
Base |
Energy |
Base |
Energy |
Base |
Energy |
Tot
kWh |
258 |
183 |
227 |
141 |
204 |
151 |
690 |
475 |
Savings |
29% |
38% |
26% |
31% |
||||
May
2002 |
June
2002 |
July
2002 |
May
- July 2002 |
|||||
House |
Base |
Energy |
Base |
Energy |
Base |
Energy |
Base |
Energy |
Tot
kWh |
250 |
138 |
192 |
75 |
200 |
80 |
642 |
293 |
Savings |
45% |
61% |
60% |
54% |
||||
Note that the performance during May-Jul, 2002 increased significantly. However, the experiments could not be continued for a full year after insulation as a lightning strike caused data logger failure on Aug 16, 2002. Soon after that the homes had to be moved to meet other needs on the NCATU campus.
NCATU
Side-by-Side Study of HUD Code Homes |
||
Characteristic |
Standard
Home |
Energy
Home |
Floor
Insulation |
R-11 |
R-13 |
Wall
Insulation |
R-11 |
R-22 |
Ceiling
Insulation |
R-20 |
R-33
+ roof deck radiant barrier |
Windows |
Single
Pane with Storm |
Low-E
Thermopane |
Exterior
Doors |
Storm
Door on Front |
Storm
Door on All |
Marriage
Wall Seal |
Fiberglass
Pad |
Sof-Seal
Gasket |
Heating
System |
Electric
Resistance |
Heat
Pump HSPF 7.5 |
Cooling
System |
Central
Air Conditioning SEER 10 |
Central
Heat Pump SEER 12 |
Water
Heater |
Electric
Water Heater |
Solar
Water Heater |
Duct
Joints |
Industry
Standard |
Sealed
with Mastic |
Duct
Leakage* |
CFM25out
= 145 |
CFM25out
= 83 |
House
Leakage* |
ACH50
= 10 |
ACH50
= 9 |

For more information and pictures visit the NCATU Center for Energy Research and Technology (CERT) project web page.