Cold Climate Case Study; High Efficiency North Dakota Twin Homes
Dave Chasar, C.E.M., P.E.
Neil Moyer
Subrato Chandra, Ph.D., member ASHRAE
Lisa Rotvold
Ralph Applegren
INTRODUCTION
|
Figure 1. Selkirk Twin Homes, Grand Forks, ND |
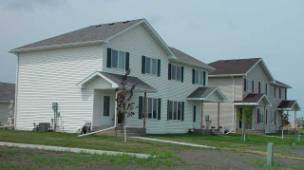
The Eastern Dakota Housing Alliance has completed 8 of 20 planned multi-family and single-family dwellings on Selkirk Circle in Grand Forks, North Dakota. Four twin-home (duplex) units were completed in March of 2003 (Phase I) and four more identical units were completed in February of 2004 (Phase II). Four additional units (Phase III) are due for completion by mid-summer, 2004. Design assistance and performance testing were provided by the Building America Industrialized Housing Project with the goal of achieving up to 50% energy savings over the 1993 Model Energy Code.
To approach this level of savings, various envelope and equipment upgrades were assessed through DOE 2 computer simulations. Base case, Phase I and Phase II homes were modeled including input from envelope and duct leakage testing. Annual combined gas and electric utility savings estimates ranged from 25% on Phase I homes to 35% on Phase II homes over the base case unit built to local minimum standards. A cost comparison of standard and improved systems was also performed.
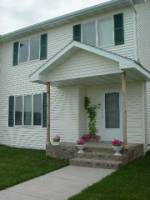 |
Figure 2. Twin Home Unit
|
Building Simulation Software
The software called EnergyGauge USA® (Parker et al. 1999), provides an input interface for performing hourly computations with the DOE2.1E simulation engine. The nearest TMY cities to Grand Forks include Fargo and Minot, North Dakota. The more severe weather in Minot (similar latitude to Grand Forks) was chosen for the annual simulations (Table 1).
TABLE 1
Minot, North Dakota TMY2 Weather Summary
Heating Degree Days |
97.5% Heating Design |
2.5% Cooling Design |
9,407 |
-20ºF |
89ºF |
Average energy rates were obtained from the serving utility for annual cost and economic comparison calculations (Table 2).
TABLE 2
2003 Utility Rates – Xcel Energy
Electric ($/kWh) |
Natural Gas Avg. |
||
Jun - Sep |
Other Months |
Average |
($/therm) |
0.0657 |
0.0578 |
0.0604 |
0.748 |
Base Case Characteristics
A base case home was simulated to provide a point of comparison for annual energy use and payback analysis. This home used the same geometry as the actual homes but with envelope construction and equipment types normally used by builders in the Grand Forks area (Table 3).
Building Envelope
The base case above-grade walls consist of 2x6 wood studs, 16 inches on center to allow for R-19 batt insulation. The wall exterior is OSB sheathing, building paper and vinyl siding. On the interior, a vapor barrier of 6-mil polyethylene is installed behind the gypsum wallboard to minimize moisture diffusion from the conditioned space into the wall cavity. High-grade windows are the norm for Grand Forks area builders. The modeled base case window is a double-pane, vinyl framed, argon-filled, horizontal slider with a low-e coating, providing a U-value of 0.34 and a Solar Heat Gain Coefficient (SHGC) of 0.33. The assumed base case infiltration is set at 5.0 ACH50 (1,227 CFM50).
The basement (608 ft2) is upgradeable as a future living space with two windows set below grade-level (in wells) for each of two bedrooms. Cement basement walls are insulated to R-11 with 2x4 framing on the interior. The basement ceiling is uninsulated and allows ample air communication with the living space above, causing the basement zone to function as a conditioned space.
Equipment
Space heating is provided by a gas furnace located in the basement, with an efficiency of 78% AFUE. Cooling is provided by a 10SEER air conditioner sized at 1.5 tons (18 kBtu) nominal. Set points of 68ºF in winter and 78ºF in summer were assumed for the DOE2 simulations. Ductwork is primarily located in the basement, completely within the building’s air barrier. Supply ductwork consists of uninsulated metal and return ducts are loosely constructed pathways to the bedrooms and main body utilizing building cavities. Total duct leakage is substantial in systems of this design but leakage to outside is minimal and considered to be zero here.
Electric water heaters (EF 0.88) are routinely used in this area according to the builder. Natural gas price spikes in the last five years was one reason sited for the continued use of electric water heating in the Grand Forks area.
TABLE 3
Twin Home Specifications
Base Case |
Phase I |
Phase II |
|
Conditioned Area (with basement) |
1840 ft2 |
Same |
Same |
Above-grade Walls |
R-19 Wood Frame |
R-19 Wood Frame |
R-15 Wood Frame + R10 sheath |
Basement Walls |
R-11 |
Same |
Same |
Vented Attic |
R-49 |
Same |
Same |
Windows |
U-0.34, SHGC-0.33 |
Same |
Same |
Gas Furnace |
60kBtu, AFUE-78 |
60kBtu, AFUE-92 |
60kBtu, AFUE-92 |
Air Conditioner |
1.5 ton, 10 SEER |
Same |
Same |
Thermostat |
Standard |
Programmable |
Programmable |
Ventilation |
None |
70% efficient HRV |
70% efficient HRV |
Water Heater |
40gallon, EF 0.88 Electric |
40gallon, EF 0.62 Natural gas |
Tankless, EF 0.83 Natural gas |
Lighting |
10% Fluorescent |
85% Fluorescent |
85% Fluorescent |
Appliances |
Standard |
Energy Star |
Energy Star |
Infiltration (ACH50) |
5.0 |
2.8 |
2.4 |
Phase I Measures
Building Envelope
Careful attention to air sealing was the only difference over the base case envelope design in Phase I. Upgraded casement-style windows replaced the base case horizontal sliders to improve envelope tightness. These argon-filled, vinyl-framed units are otherwise identical to those assumed in the base case home with a 0.34 U-value and 0.33 SHGC. Blower door tests of the Phase I units show an average leakage rate of 2.8 ACH50 was attained based on 689 CFM50 as shown in Table 4 including the basement.
TABLE 4
Measured Phase I Envelope Tightness
Twin Home Unit |
1 |
2 |
3 |
4 |
Average |
CFM50 |
737 |
728 |
574 |
716 |
689 |
ACH50* |
3.00 |
2.97 |
2.34 |
2.92 |
2.81 |
Equipment
The 78% furnace was replaced with a 92.6% AFUE, sealed combustion, condensing gas furnace. Combustion air is drawn from outside, completely sealing it from the inside space and minimizing the chance of leaking combustion products to the conditioned space. A programmable setback thermostat further reduces energy demand with assumed swings of 5ºF in winter and 3ºF in summer assumed for the DOE2 models. Savings were obtained by replacing the electric water heater with a power vented natural gas model. This is not an exceptionally efficient gas unit (EF 0.62) but the power-venting feature provides a measure of combustion safety.
Recent fluctuations in the price of natural gas complicate payback calculations for both the furnace and water heater upgrades. The 2003 average local rate ($0.748/therm) was obtained from the serving utility for the economic calculations. In the ten years prior to 2000, gas prices were relatively stable with a slight rise in the middle of the year when heating demand is reduced. This trend has roughly continued after 1999 but a substantial increase in winter prices as seen in 2000-2001 (Figure 3) would have a considerable impact on furnace upgrade savings, making the high efficiency unit look much more favorable against the base case when prices increase. For the gas water heater, on the other hand, increasing prices would reduce its cost effectiveness relative to the base case electric model, which is powered by an historically more stable commodity that was 26% cheaper than the national average of $0.0813/kWh in 2003 (EIA 2004).
Figure 3. North Dakota Natural Gas Pricing
Source: U.S. Energy Information Administration (converted to $/therm
from $/Mcf using estimated heat content of 1,029 Btu/cubic foot)
Considerable effort was focused on replacing incandescent fixtures with fluorescent lighting, yielding a simple payback of 6.5 years. The typical 10% fluorescent fraction was increased to 85% with a combination of linear and compact fluorescent light (CFL) fixtures. The only locations with standard edison-socket fixtures are hallways, bathrooms (with dimmers) and kitchen can lights (also with dimmers).
An Energy Star dishwasher and horizontal-axis clothes washer provide an annual savings of $37 by reducing electrically generated hot water an estimated 10 gallons per day. The typical 60 gallons of hot water use per day was reduced to 50 with an estimated savings of 8 gallons from the horizontal-axis washer (Tomlinson and Rizy 1998) and 2 more gallons from the dishwasher. Savings from reduced water and detergent use are not included. The Energy Star refrigerator saved an estimated $34 (1,100 kWh/yr vs. 450 kWh/yr) in electrical energy but $10 of this is lost per year due to increased heating demand (approximately 14 therms).
A heat recovery ventilator (HRV) mounted in the basement provides controlled mechanical ventilation with an energy penalty estimated at $45/year. The unit contains an 80-watt fan that introduces 75 CFM of outside air while exhausting a similar amount at a heat transfer efficiency of 70%. Attempting to meet the new ASHRAE 62.2 standard (ASHRAE 1999) would require 42 CFM of continuous ventilation. For these simulations however the old ASHRAE guideline of 0.35ACH was used, calling for a continuous rate of 25CFM. The HRV can operate either continuously or on an intermittent 20 minutes on, 40 minutes off cycle. Intermittent operation was simulated to meet the old guideline.
Phase II Measures
|
Figure 4. XPS foam at corner |
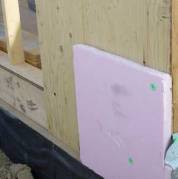
The unfaced XPS foam sheathing has a perm rating of 1.1 and is considered a vapor retarder at the wall exterior. This is in addition to the interior vapor barrier (6-mil poly) installed behind the gypsum wallboard at the wall interior. Installation of two vapor barriers in this manner leaves the wall vulnerable to moisture accumulation should water unintentionally enter the cavity. There will be only a slight ability for the wall to dry to the outside. Another recommendation calls for removing the interior vapor barrier and relying on two coats of latex paint on the interior to limit diffusion from the conditioned space into the wall. This option allows the wall to dry to some extent in both directions but was not chosen by the builder.
Blower door tests of the Phase II units show an average leakage rate of 2.4 ACH50 was attained based on 598 CFM50 as shown in Table 5 including the basement.
TABLE 5
Measured Phase II Envelope Tightness
Twin Home Unit |
1 |
2 |
3 |
4 |
Average |
CFM50 |
736 |
474 |
685 |
495 |
598 |
ACH50* |
3.00 |
1.93 |
2.79 |
2.02 |
2.44 |
An instantaneous gas water heater with an energy factor of 0.83 provided an estimated annual savings of $42 over the phase I gas model. Savings over the base case 40-gallon electric water heater are estimated at $94, providing a 13-year simple payback. The manufacturer claims a 20 to 25 year lifespan.
Ground water temperatures in Grand Forks routinely reach below 40ºF during the winter months, which would drop hot water output below 4 gallons per minute (GPM) at a 120ºF supply temperature according to manufacturers performance data. The new homeowners were notified that, while hot water would always be available, some changes in usage habits might be required to allow for reduced capacity. No homeowner complaints were reported during an exceptionally cold 2003/2004 winter season in Grand Forks, which saw a new all-time record low of -44ºF on January 30, 2004 (NOAA 2004). Impromptu discussions with homeowners during envelope testing (April 29-30, 2004) indicated general satisfaction with the units to date.
Estimated Annual Energy Use and Cost Comparison
Phase I and Phase II energy measures were evaluated progressively by adding one measure at a time to the base case home. Energy measures were added in the order listed in Tables 6 and 7 to arrive at estimated savings numbers for individual measures while allowing for interaction of the building systems. Major construction components or equipment were added first such as envelope measures and the gas furnace. Hot water saving, Energy Star appliances were added prior to the water heater upgrade to highlight their savings with respect to electrically heated water.
One row in Tables 6 and 7 shows the cumulative effect of all measures added to the base case home. Estimated saving in this row includes the cumulative effect of all measures incorporated together in the DOE2 simulation. The heat recovery ventilator (HRV) is broken out from the other measures to provide a meaningful simple payback and first year cash flow figures for the other cumulative measures. The HRV is considered an essential component for the indoor air quality of these homes but comparing it to a base case home without ventilation means no relative savings are attained thus this measure is added in a separate row. With the exception of the HRV all measures show a positive cash flow on a 6%, 30 year fixed rate mortgage beginning in the first year.
TABLE 6
Economic Assessment of Phase I Measures
Energy Measure |
Annual Savings |
Installed Cost |
Simple Payback |
First Year Cash Flow |
Reduce infiltration to 2.8 ACH50 |
$90 |
$325 |
3.6 |
$68 |
Upgrade to 92% direct vent furnace |
$52 |
$600 |
11.5 |
$11 |
Switch to Programmable Thermostat |
$23 |
$130 |
5.7 |
$11 |
Upgrade to Energy Star appliances* |
$61 |
$730 |
12.0 |
$12 |
Change to EF-0.62 power vented water heater |
$52 |
$520 |
10.0 |
$16 |
Increase from 10% to 85% fluorescent lighting |
$31 |
$200 |
6.5 |
$17 |
All Measures |
$309 |
$2,505 |
8.1 |
$135 |
Heat recovery ventilation @75cfm, 33% RTF |
-($45) |
$1,400 |
N/A |
-$134 |
All Measures with HRV |
$264 |
$3,905 |
14.8 |
$1 |
- First year cash flow based on 30 year fixed rate mortgage with interest rate of 6%, down payment of 5% and discount rate of 5%. A general inflation rate of 3% per year was applied to the upgrade cost of measures replaced at end of lifetime. Final value of equipment is determined by linear depreciation over lifetime. Interest paid on mortgage is considered tax deductible using a tax rate of 28%. Energy costs escalate at 3% per year. A property tax rate of 0.8% was applied to the energy upgrade cost and is inflated at 3% per year.
Two alternate measures used in Phase II were XPS foam board sheathing and tankless gas water heaters, which were unfamiliar to the builder and plumbing subcontractor. This meant a larger labor premium was included in the installed cost than may be the case in the future if they continue to be used. The XPS foam in particular is being considered for other projects by the builder as plywood prices continue to remain high in the area.
TABLE 7
Economic Assessment of Phase II Measures
Energy Measure |
Annual Savings |
Installed Cost |
Simple Payback |
First Year Cash Flow |
Upgrade walls to (R10 sheath + R15 FG batt) |
$72 |
$600 |
8.3 |
$31 |
Reduce infiltration to 2.4 ACH50 |
$106 |
$325 |
3.1 |
$82 |
Upgrade to 92% direct vent furnace |
$40 |
$600 |
15.0 |
-$1 |
Switch to Programmable Thermostat |
$18 |
$130 |
7.2 |
$6 |
Upgrade to Energy Star appliances* |
$60 |
$730 |
12.2 |
$12 |
Change to EF-0.83 tankless gas water heater |
$94 |
$1,250 |
13.3 |
$10 |
Increase from 10% to 85% fluorescent lighting |
$31 |
$200 |
6.5 |
$18 |
All Measures |
$421 |
$3,835 |
9.1 |
$158 |
Heat recovery ventilation @75cfm, 33% RTF |
-($43) |
$1,400 |
N/A |
-$134 |
All Measures with HRV |
$378 |
$5,235 |
13.8 |
$24 |
- First year cash flow based on 30 year fixed rate mortgage with interest rate of 6%, down payment of 5% and discount rate of 5%. A general inflation rate of 3% per year was applied to the upgrade cost of measures replaced at end of lifetime. Final value of equipment is determined by linear depreciation over lifetime. Interest paid on mortgage is considered tax deductible using a tax rate of 28%. Energy costs escalate at 3% per year. A property tax rate of 0.8% was applied to the energy upgrade cost and is inflated at 3% per year.
A performance comparison of the base case, and improved structures is shown in Table 8. The increased heating design load in Phases I and II over the base case is caused by the addition of 75 CFM of ventilation introduced on a 20 minutes ON, 40 minutes OFF cycle, which the base case does not have. The DOE2 model predicts the need for very little cooling, however many new homes in this area are being built with central air conditioning.
TABLE 8
Simulated Performance Comparison of Base Case and Improved Homes
Base Case |
Phase I |
Phase II |
||||
HERS |
85.2 |
89.7 |
92.2 |
|||
Total Annual Energy |
Cost |
Cost |
Savings |
Cost |
Savings |
|
$1,079 |
$815 |
25% |
$701 |
35% |
||
Cost |
Design Load (kBtu/h) |
Cost |
Design Load (kBtu/h) |
Cost |
Design Load (kBtu/h) |
|
Heating |
$458 |
29.8 |
$366 |
33.4 |
$294 |
30.7 |
Cooling |
$15 |
9.9 |
$11 |
10.6 |
$10 |
10.3 |
Hot Water |
$245 |
$157 |
$116 |
|||
Total |
$718 |
$534 |
$420 |
|||
Summary and Conclusions
A total of eight twin home units (four each of Phase I and Phase II) have been built to date on Selkirk Circle in Grand Forks, North Dakota with the goal of achieving up to 50% energy savings over the 1993 Model Energy Code. DOE 2 computer models of each phase plus a theoretical base case house built to local minimum standards were devised to determine energy savings and cost effectiveness. Phase I and Phase II home models included input from envelope airtightness testing results. Estimated combined gas and electric utility savings ranged from 25% on Phase I homes to 35% on Phase II homes over the base case.
The increased utility savings of Phase II over Phase I come from two energy saving measures unique for this area: Extruded Polystyrene (XPS) foam sheathing and tankless gas water heating. Simple paybacks for these measures were 8.3 and 13.3 years respectively. Electric water heaters are the current norm in the Grand Forks area, but with electricity 26% below the national average and natural gas prices on the rise simple payback on the tankless model was relatively long. In addition, fluctuating natural gas prices complicate the economic analysis. Initial concerns of how the tankless water heater would perform in this extreme climate were met with positive feedback through the first winter, which was colder than normal, including an all-time record low of -44ºF set at the Grand Forks International Airport on January 30, 2004.
The low water vapor permeance of rigid XPS foam sheathing (1.1 perms) presents a dilemma in this climate where an interior vapor barrier (usually 6-mil polyethylene) is considered mandatory to minimize moisture diffusion from the conditioned space into the wall cavity. The installation of two vapor barriers leaves the wall vulnerable to moisture accumulation should water unintentionally enter the cavity. One recommendation calls for removing the interior vapor barrier and relying on two coats of latex paint on the interior to limit diffusion from the conditioned space into the wall. This option allows the wall to dry to some extent in both directions but was not chosen by the builder.
Acknowledgement
This work is sponsored, in large part, by the Building America program of the US Department of Energy (DOE), Office of Energy Efficiency and Renewable Energy, Building Technologies Program under cooperative agreement number DE-FC36-99GO10478. The authors appreciate the encouragement and support from Mr. George James and Mr. Chris Early, DOE program managers in Washington, DC. They are grateful to FSEC colleagues Mr. Philip Fairey and Mr. Robin Vieira and Building America collegues Dr. Joseph Lstiburek, Mr. Armin Rudd, Mr. Brad Oberg and others for their many helpful suggestions and comments over the past several years. Special thanks also go to Mr. Kim Christianson of the North Dakota Department of Commerce, Division of Community Service which provided funding for building upgrades.
Disclaimer: This report was prepared as an account of work sponsored by an agency of the United States government. Neither the United States government, nor any agency thereof, nor any of their employees, makes any warranty, express or implied, or assumes any legal liability or responsibility for the accuracy completeness, or usefulness of any information, apparatus, product, or process disclosed, or represents that its use would not infringe privately owned rights. Reference herein to any specific commercial product, process, or service by trade name, trademark, manufacturer, or otherwise does not necessarily constitute or imply its endorsement, recommendation, or favoring by the United States government or any agency thereof. The views and opinions of authors expressed herein do not necessarily state or reflect those of the United States government or any agencies thereof.
References
Parker, D., P. Broman, J. Grant, L. Gu, M. Anello, R. Vieira and H. Henderson. 1999. EnergyGauge USA: A Residential Building Energy Design Tool. Proceedings of Building Simulation '99, Kyoto, Japan. International Building Performance Simulation Association, Texas A&M University, College Station, TX.
Tomlinson, J., D. Rizy. 1998. Bern clothes washer study final report. Oak Ridge National Laboratory.
National Oceanic and Atmospheric Administration, National Weather Service, 2004. Climatology web page, http://www.crh.noaa.gov/fgf/data/climate/gfkclmsea.
Energy Information Administration, Average U.S. Residential Electric Prices, Table 9.9, April 2004, http://www.eia.doe.gov
ASHRAE, 1999. ASHRAE Standard 62.2P-1989: Ventilation and acceptable indoor air quality in low-rise residential buildings, American Society of Heating, Refrigerating and Air-Conditioning Engineers.